
For all of my readers who celebrate Christmas, I hope that you had a wonderful holiday. I know that many of us spent this holiday with fewer of our friends and family and I really, really hope that we never take for granted the opportunities to be with them in the future. Two of my siblings and one of their spouses work in healthcare and have already been vaccinated. I can’t begin to imagine the relief that must provide. In my extended family, we are all eager to get our vaccines as soon as they’re made available to the rest of us.
If you did gather with others during the holiday, I offer no judgment or condemnation. I really and truly hope that you had a great time that was worthy of the risk. I want to remind you that the responsible thing to do now is to behave as though you were infected during your gatherings and self-quarantine for the next 14 days, seeking a test around day 7 after the high exposure event (so next Saturday). Avoid any and all contact with anyone >65 years of age and who might have an underlying medical condition that might contribute to a more severe case of COVID-19. Please do NOT attend any New Years Eve/Day gatherings.
If you are >65 years old or have an underlying medical condition that might predispose you to more complicated cases of COVID-19, then I strongly advise you to shelter in place for the next 2-3 weeks. The people who gathered at Christmas are going to be infectious in the coming week as they go about town, eat in restaurants, etc. Then those who gather for New Year’s Eve will continue the cycle for another week. Of course, these infections don’t stop with the people who were exposed during these high transmission events. But if a person was willing to ignore the public health guidance and gather anyway for the holidays, then they’re probably going to ignore the public health guidance to self-quarantine afterwards too. I just don’t want any of you being hurt as a consequence.
Combined Data
Before we begin, I should remind everyone that the data are impacted this week by holiday and weekend reporting delays. The same will be true for next week with the New Year holiday. So while it looks like there are positive signs in the data, I would caution you against getting your hopes up. The graph below shows how three of our main indicators are going week over week. Cases are represented by the blue line and correspond to the left y-axis. Hospitalizations and deaths (gray and red lines, respectively) correspond to the right y-axis.

This week we saw slightly fewer cases than last week, a total of 44,381 between PCR and antigen-identified cases. That same number is about what Georgia accumulated as a state between the start of the pandemic and Memorial Day. Now that’s our weekly total.
New hospital admissions for COVID-19 also declined, at a greater rate than cases, with only 1375. That’s a decline of 22% compared to the previous week, but we saw a significant dropoff in hospital admission reporting starting Christmas day and continuing for the past two days. So again, don’t get too excited about this number. Because going from 300+ admissions for three days straight to 91 is not normal - the virus doesn’t recognize holidays.
Deaths inched up this week, to 277, an increase of 19% compared to the previous week. Like hospital data, death reporting is typically impacted by weekend/holiday effect.
Testing
This week, Georgia set a new record for total PCR test output, at 259,364 tests in a single week. Of those tests, 14.3% were positive and this is higher than the peak of the summer surge now. The graph below shows how test output (blue line) and percent positive rate (red line) have trended weekly over time. The goal for percent positive rate is to be at or below 5% (gray dashed line).
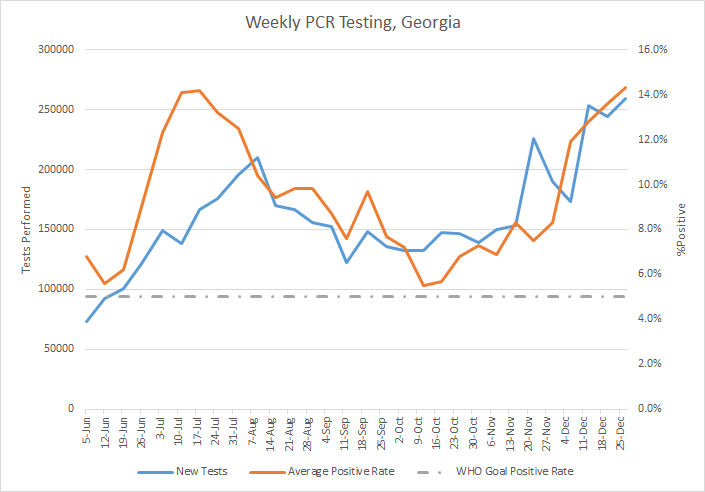
When our test positive rate is high like it is now, it means that we likely aren’t testing widely enough to catch most/all cases of COVID-19. Those missed cases may not know that they’re infected and unknowingly contribute to disease transmission in their community. So even as we have a huge number of cases this week, it is likely an undercount of the true amount of disease that is out there in Georgia.
The state of Georgia does not provide any data on the total number of antigen tests performed** or how many of them were positive. **They will tell you this number through an open record request for a fee, and I do so monthly. However, we do know that antigen tests identified 23% of this week’s case total.
Cases
The number of combined new cases (by date of report) is as follows:
- 24 hours: 2949 by PCR + 562 by antigen = 3511 (+0.6%)
- 7 days: 34,119 by PCR + 10,262 by antigen = 44,381 (+7.5%)
- 4 weeks: 123,106 by PCR + 39,677 by antigen = 162,783 (+34.7%)
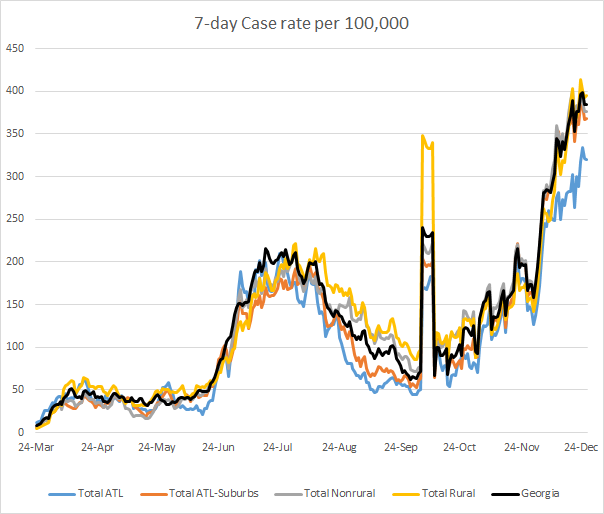
The new statewide total is 632,299, combining PCR and antigen-test identified cases. Bear in mind that these case totals are likely an under count of our actual case count - it’s a problem that plagues public health for multiple diseases and especially so when a disease has so many asymptomatic cases, as COVID-19 does. But also because we know that our percent positive rate is high. As I indicated in the combined data section, our weekly total is equal to all of the COVID-19 cases that Georgia identified by Memorial Day. Our number of cases have grown nearly 35% in the past month and of all the cases that have been recorded in Georgia to date, 25.7% were reported in the past 4 weeks. In other words, one in four of the cases we’ve had so far were in the last month, even as we are in the 9th month of this pandemic. It’s sort of a breathtaking amount of disease that Georgia is experiencing right now. In the graph below, I show the Georgia cases by date of report for both PCR and antigen cases for each county type. Ignore the big bump around 11Oct - that was a data dump of antigen cases. You’ll notice that we are well above the previous summer surge now. In fact, our 7-day rolling average is now 80% higher than our previous peak. But the Atlanta counties (Fulton and DeKalb) are faring better than other county types in the state.
The Georgia DPH does not provide any demographic data for cases identified by antigen test - even though they investigate each of those cases the same way they investigate PCR-identified cases. However, here’s what we do know regarding the age of the new cases each week, based solely on PCR case data. The graph below shows 8 week timelines for each age group, side by side.

Cases increased for every age group this week, except for 10-17 year olds. For 18-29 year olds, their weekly case total has jumped 189% in the past 8 weeks. They continue to be the age group with the largest weekly total, as has been the case for most of the pandemic.
There’s something alarming in the race data for weekly case totals. Look at how much the “unknown” category has grown in the past 8 weeks. This is an indication that our state’s ability to investigate cases or even do the follow up to gather data regarding the cases that have already been identified is severely diminished. There’s a good chance that our contact trace investigators are overwhelmed and struggling to keep up with demand.

Here’s a look at how the 14-day case rate per 100,000 compares across Georgia’s counties. My map will look different than the one from Georgia DPH because their map only uses PCR-identified cases for their calculation whereas my map also includes the antigen-identified cases. You can click on the map below to see a live image where you can hover/click over your county of interest.

Hospitalizations
As mentioned earlier, there’s likely a holiday/weekend effect happening with the reporting of new COVID-19 admissions and ICU admissions. For the moment, it looks like things are decreasing for both of those metrics, but we should brace for larger than normal numbers next week as delayed reports come in.

Meanwhile, we continue to set new records for the number of patients currently hospitalized for COVID-19. Today we broke the 4,000 mark for our COVID-19 patient census, at 4104. This number doesn’t seem to be impacted by the holiday/weekend effect. Our patient census is now 28% higher than our highest point in the summer surge. In fact, 27.7% of all Georgians in the hospital right now are there because of COVID-19. The national average for COVID-19 patient census is 14% for 19-25Dec, according to the 26Dec2020 Community Profile Report provided by the Department of Health and Human Services. In other words, the demand on our hospital infrastructure is about twice as high as for the rest of the country.

Adult ventilator usage is way up this week also. Some of this is due to a yet to be explained reporting error according to the Georgia Geospatial Information Office, but the usage rate continued to increase even after this error was corrected.

Deaths
The number of new confirmed deaths (by date of report) is as follows. The percentage in parentheses indicates how the increase compares to Georgia’s cumulative total at the start of each window of time.
- 24 hours: 4 (+0.04%)
- 7 days: 277 (+2.9%)
- 4 weeks: 936 (+10.7%)
This week the number of deaths increased 19% compared to last week. The current statewide total of confirmed deaths is 10,689 and of those, 9.6% were reported in the last 4 weeks alone.
As for cases and hospitalizations, here is a graph of deaths by age over time. As you get to the next age group, the timeline starts over. The most recent week is shown in maroon. A reminder, this graph is built using data for deaths among PCR-identified cases only. This week we saw increases for every age group >50 years of age.

Next, let’s look at how deaths are impacting different county types across the state. The graph below shows the 7-day death rate per 100,000 people. So it is adjusted for population and counties are divided based on their association to Atlanta or their population density (rural <50,000 residents). You can check how your county is classified here. The black line below shows the statewide average.
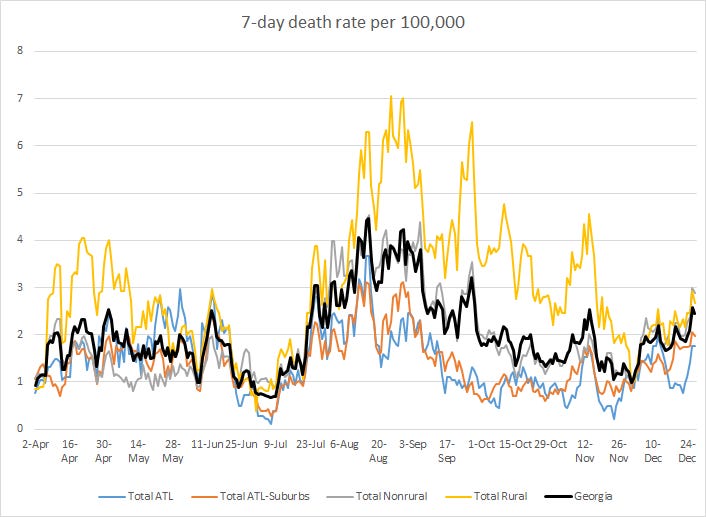
In the past couple weeks I’ve said that the upward signs we were seeing in the statewide data could just be the noise of day to day and week to week variation as the trend continues downward. But I think this week we can see that the upward trend is sustained and real, driven largely by the increases in death rate for rural and nonrural counties outside of the Atlanta metro. The 7-day rolling average for the statewide death rate (by date of report) is 45% less than what we experienced at the height of the summer surge.
References
https://dph.georgia.gov/covid-19-daily-status-report
https://beta.healthdata.gov/National/COVID-19-Community-Profile-Report/gqxm-d9w9
https://covid-gagio.hub.arcgis.com/
https://amberschmidtkephd.substack.com/p/pcr-percent-positive-rate-by-county
Georgia COVID-19 Updates is a free newsletter that depends on reader support. If you wish to subscribe please click the link below. There are free and paid options available.
My Ph.D. is in Medical Microbiology and Immunology. I've worked at places like Creighton University, the Centers for Disease Control & Prevention and Mercer University School of Medicine. All thoughts are my professional opinion and should not be considered medical advice.