

The Daily Digest, 22Apr2021
Georgia COVID-19 Updates

Vaccines
Tomorrow the Advisory Committee on Immunization Practices will meet to make a decision (hopefully) regarding the use of the Johnson and Johnson vaccine. I expect that the vaccine will be re-recommended for use. The question to me is whether they will recommend its use only for certain populations (i.e. older adults) or make it available to everyone with additional warnings.
In the meantime, vaccination rates are slowing nationally. This isn’t because of a shortage of vaccine, but dropping demand. This is despite every person over the age of 16 becoming eligible nationwide on 19Apr. The graph below comes from the New York Times.

This doesn’t mean that demand doesn’t exist at all. Rather, it means that we are likely reaching the maximum number of people who would have been served by existing vaccine outreach strategy. We’re going to get to a point where the people who wanted to go to a mass vaccination site have likely been served. It means that states need to reorient their strategies to meet people where they are. Vaccines should be available in doctor’s offices, high schools (16-17 year olds), college campuses, workplaces, churches, grocery stores, etc. I mean, put them in ice cream trucks and go neighborhood to neighborhood. Can you imagine? Get a vaccine and a Choco Taco during the 20 minute waiting period? Done, right? This community outreach effort is expensive, time and resource intensive, and inefficient. But it’s the work that needs to be done.
Here’s another way to look at the problem. This graph comes from Surgo Ventures, who has done a lot of polling and analysis of the COVID-19 vaccination effort. The top bar summarizes survey responses from around the end of 2020. The bottom bar is more recent - in mid-March 2021. They classify respondents based on their attitudes or fears about the vaccine. Early on, about 40% of the US population was either vaccinated or enthusiastic and motivated to get vaccinated as soon as they were eligible. There were another 43% who fell into the “persuadable” camp. These folks were the “watch and sees” or those who worry about missing time from work for the vaccine, and those who thought the vaccines were rushed through development. These are the folks who might be persuaded if given the right data and compelling, logical argument. The remaining 17% were classified by Surgo Ventures as the conspiracy believers. These are the people most likely to say they would never get the vaccine, no matter the argument. I would imagine that the only way to get these populations to get vaccinated is if it were required that they do so. I’m not sure if or when that will happen.

Meanwhile, The bar on the bottom shows us that the vaccine effort has been incredibly successful so far. People seeing their friends and neighbors vaccinated has normalized the process, drawing more people into the vaccinated or enthusiast camp, now at 66% of adults. An estimated 14% jumped from the wait and see to the motivated to get vaccinated group. Inroads were also made with the cost-anxious and to a lesser degree among the system distrusters. And 22% of adults remain in the persuadable group. But the conspiracy believers remain stubbornly at 16% of the population polled. Because vaccines are only available at this time to people over the age of 16, we would need 90% of adults to be vaccinated in order to reach herd immunity, protecting children and other populations who can’t be vaccinated for medical reasons, etc. So even if we were able to win over all of the “persuadables” we would get to 84% of the population vaccinated. That’s really pretty good, but we’d all be better off at 90%. But just as we can normalize vaccination, we can normalize hesitancy too. We need to talk about hesitancy when the time comes, but we aren’t there yet. There are still a lot of people to vaccinate who are persuadable. So I would caution my friends in the media to think about the scope of the hesitancy problem - be careful that you aren’t normalizing hesitancy behavior by giving it outsized focus.
This is why I’ve argued that the only way we’re getting to herd immunity is to also vaccinate children. That may be coming sooner rather than later with Pfizer applying for EUA for 12-15 year olds and more studies ongoing for younger children. With the current pace of vaccination, we could reach 90% of the population 16+ vaccinated by August 15th. With the slow down, that goal date may extend into the fall.

Is it a deal breaker if we don’t get to 70-90% of the total US population vaccinated? Perhaps not. Disinformation has been public health’s unfortunate companion since its inception and vaccine hesitancy is not a new phenomenon. Despite that, we have successfully eradicated smallpox. We have pushed once endemic diseases like polio into the periphery through vaccination. There will be communities that reach herd immunity and those that don’t. The ones that reach herd immunity will be able to resume life as before the pandemic with little impact on their hospitals and COVID-19 will no longer be a leading cause of death. Those that don’t reach herd immunity will continue to see outbreaks of COVID-19, surges on hospital resources and deaths. This is not unlike the circumstances that led to large measles outbreaks prior to the COVID-19 pandemic. Mess with herd immunity and bad things happen. And it’s also important to remember that just like the pandemic was only an airplane or cruise ship away from American shores, these COVID-19 outbreaks will be a car ride away from vulnerable communities. So rather than all public health decision making being in the hands of the Governor, we need to see autonomy for public health decisions for mayors.
But what I think this will ultimately mean is that the communities who have been medically underserved prior to the pandemic will continue to be the ones who suffer the worst outcomes of COVID-19 in the future. The disparities in health outcomes between rural and urban communities and between White populations and communities of color will continue to widen. Take the graph below from the Kaiser Family Foundation as an example of what I’m talking about, particularly for rural communities.

More of the rural population is already vaccinated than their urban and suburban counterparts. This is likely due to the supply mismatch that has happened across the country, with freezers full of vaccine in rural counties and shortages elsewhere. But if we look at the rest of the bar graph, the future is more grim for rural counties. At maximum, we can hope for 70% of rural residents to get vaccinated, according to this poll. Compare that to 84% of urban residents and 79% of suburban residents. It’s noteworthy that this disparity isn’t due to lack of resources or healthcare access. It’s a stark difference in willingness to be vaccinated. Does this mean we give up on rural communities? No, not to me anyway. It means we vaccinate as many of the ASAP and wait and see people as we can and hope for the best. Welcome to the field of public health.
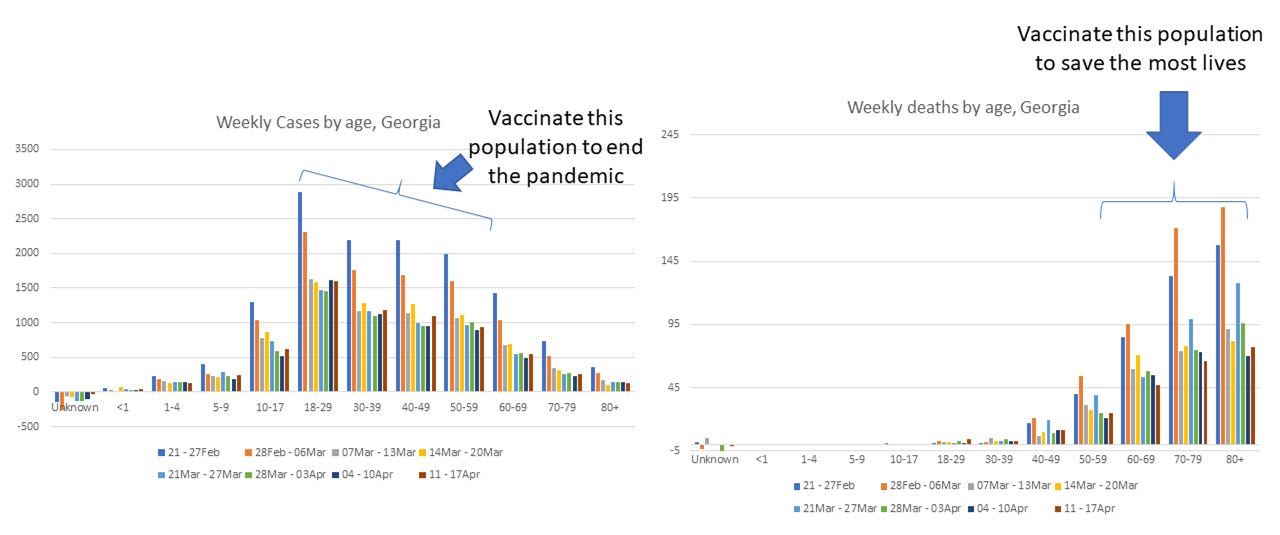
But there really is a lot of hope now that vaccine eligibility has expanded to all 16 and up nationwide. Early in the vaccine rollout, the doses were prioritized for older populations because that’s the age group that accounted for the most deaths. If you have a life-saving technology, you want to use it where it can do the most good first, right? But if you want to end the pandemic, you have to vaccinate the primary drivers of infection. After all, if we reduce cases we also reduce hospitalizations and deaths. If we bring the pandemic down to a case burden and disease severity that’s similar to seasonal influenza, then that’s manageable. It means most things goes back to normal.
As we’ve learned throughout the pandemic, expecting people to do the right thing and take actions to protect their community has not proven to be a reliable strategy for success. We have at least three surges to prove that it’s not successful. But I’d like to give it another shot anyway. The illustration below comes from the New York Times and it is designed to show the effects of social distancing. But it can be used to show the impact of vaccination too. On average, a person infected with the original variant of COVID-19 goes on to infect 2 additional people. If the two newly infected people go on to infect an additional two people and so on for 6 transmissions, we end up with a situation where there are 64 infections, as shown in this example. Using Georgia’s numbers so far, that would translate to 1.3 deaths and 3.6 people in the hospital. This is the situation on the top of the graphic. For the bottom of the graphic, we can see what happens when someone is vaccinated. With their immunity, they protect all of those downstream people from the worst that COVID-19 can do. Those downstream people could be exposed by other infected individuals. But if enough of us get vaccinated, the populations we protect overlap and we reduce the chances of the virus finding a person who is unable to be vaccinated (i.e. children) or who might be most vulnerable to severe complications. I’m not going to lie, there’s a selfish motivation for getting vaccinated. But it’s not just about you. Even more importantly, it’s about protecting all these people around you too. When you get vaccinated, you yourself are saving lives. Ask someone who has saved someone’s life before - they will tell you that its among the most amazing and rewarding things they’ve ever done. You might not see the lives that you save by being vaccinated, but you are saving lives.

But we find ourselves in a situation with a more transmissible variant. So instead of a single person on average infecting 2 people, they go on to infect 3 additional people. So through 6 transmissions we’re talking about 729 infections, 14.6 deaths, and 40.8 hospitalizations. So the stakes for getting vaccinated are greater than they were before the arrival of the new variant. And you have the opportunity to be a hero in this pandemic that has caused so much pain. If you are still in the wait and see camp or have questions about the vaccines, there’s a good chance I may have answered those questions in one of my Vaccine Q&As. You can find a link to all of them here. Please get vaccinated.
The latest on Georgia
Testing
Today there was a net increase of 20,902 newly reported PCR tests, 4.3% of which were positive. There were 9193 newly reported antigen tests and 8.7% of them were positive. PCR accounted for 55% of today’s newly reported cases (net increase) and antigen testing identified the other 45%.

The map above comes from the CDC COVID Data Tracker and describes the change in weekly PCR test positivity. Any counties in the blue color saw their test positivity increase by more than 2% in the past week. Rising test positivity is an indication that current testing output is insufficient to accurately measure case rate for that area. So the case rate that we are aware of is more likely to be an undercount. There’s a lot of blue in the map.
Cases
Today there was a net increase of 935 newly reported PCR cases and 770 newly reported antigen cases for a combined total of 1705 cases. The graph on the left shows the 7-day case rate per 100,000 over time for different county types in Georgia. At the moment, case rate is highest in the Atlanta suburbs and lowest in rural counties. The bar graph on the right shows cumulative case rate per 100,000. We can see that Atlanta counties are the anomaly here, with a significantly lower cumulative case rate compared to the rest of the state. I think a lot of this has to do with what happened in the winter surge where Atlanta fared better than other county types.

Hospitalizations
Today there was a net increase of 93 new COVID-19 admissions to the hospital and 22 admissions to the ICU. The number of patients in the hospital continues to rise. The graph below is built by the New York Times using HHS data for Georgia. This data set offers some advantages over the one used by the Georgia Geospatial Information Office data hub in that it tracks confirmed as well as suspected COVID-19 patients and includes children.

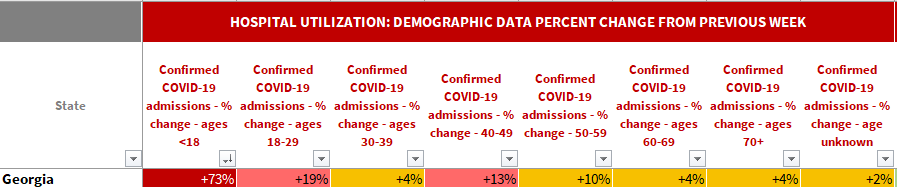
We can also use HHS data to see how COVID-19 admissions are changing this week by age group. So far this week Georgia is seeing a 73% increase in pediatric COVID-19 admissions, 19% for young adults aged 18-29 years and 13% increase for those 40-49. All of these are considered to be in the red zone. It’s good to see that hospitalizations aren’t increasing dramatically for those 60+ and this is probably due in large part to the vaccine. But the younger adults in the general population (not healthcare workers or other prioritized groups) only became eligible for vaccines this week. Of course, there is no vaccine currently authorized for children under the age of 16.
Deaths
Today there were 32 newly reported confirmed COVID-19 deaths and 14 probable deaths (net increase compared to yesterday’s totals). The state’s 7-day death rate is 24% below the pre-winter surge baseline. Let’s keep that number going down for good.
References
https://www.nytimes.com/interactive/2020/us/covid-19-vaccine-doses.html
https://static1.squarespace.com/static/5f7671d12c27e40b67ce4400/t/6075bc376125561b742e9ff5/1618328632135/Final+Press+Release-Surgo+Ventures+Gen+Pop+Followup+Survey+%281%29.pdf
https://www.kff.org/coronavirus-covid-19/poll-finding/kff-covid-19-vaccine-monitor-rural-america/
https://www.cdc.gov/measles/cases-outbreaks.html
https://www.nytimes.com/2020/03/19/health/coronavirus-distancing-transmission.html
https://amberschmidtkephd.substack.com/p/vaccine-q-and-a-5th-edition
https://covid.cdc.gov/covid-data-tracker/#county-view
https://dph.georgia.gov/covid-19-daily-status-report
https://covid-gagio.hub.arcgis.com/
Georgia COVID-19 Updates is a free newsletter that depends on reader support. If you wish to subscribe please click the link below. There are free and paid options available.
My Ph.D. is in Medical Microbiology and Immunology. I've worked at places like Creighton University, the Centers for Disease Control & Prevention and Mercer University School of Medicine. All thoughts are my professional opinion and should not be considered medical advice.