

The Daily Digest, 21Sep2020
Georgia COVID-19 Updates

The World
Globally, the SARS-CoV-2 virus that causes COVID-19 disease has sickened >31 million people (+2 million since last week) and killed 960,812 (+36,599 in the past week) as of this morning.

The US is a warm spot (not red hot as before), as is much of the Western hemisphere. However, we climbed this week from 26th to 21st in the world for weekly case rate. Our weekly case rate per 100,000 is 88 (up from 75). Some of the hottest areas for disease right now are in the Mediterranean and Central and South America.
For deaths, our weekly death rate per 100,000 increased slightly to 1.7 (up from 1.6 last week) and we are ranked #18 in the world for this (down from #15 last week). Death rates are highest in South America.
The United States

As hot spots go, they are mainly concentrated throughout the Midwest. Georgia is ranked #21 in the nation for 7-day case rate per 100,000, a drop from #14 last week. This is really good news. However, last week we saw signs that our case decreases have leveled off. So this good news may be temporary. Of the top 10 states, only 2 are in the South.
Last week, we had four counties on the top 20 counties in the nation list for cases per 100,000 in the past week. This week, we only have one county on that list, Stewart, ranked #12.
As cities go, Georgia only has one city in the top 20 for case rate per population in the past 2 weeks. Athens has dropped from #4 last week to #20 this week.

According to the CDC, Georgia has a cumulative test rate of 24,738 per 100,000 residents and we are ranked 11th in the nation for this. If we look at percent positive rate using the map below, you can see that all of the South is experiencing a high rate, but this week Georgia is now in the second color tier. It appears this is based on cumulative data, though the website is not clear on that. The Georgia Department of Public Health indicates that our overall cumulative percent positive rate is 10.3% as of yesterday’s update (9/20/2020).

To look at more recent testing data, we have to go back to the New York Times resource. In the past week, it notes that Georgia dropped in the rankings from 23rd in the nation (205 tests performed per 100,000 in the past 2 weeks) to 43rd in the nation (182 tests per 100,000). Together with the Harvard Global Health Institute, they estimate that Georgia is performing at 34% of the ideal testing target (down from 44% last week). This seems to disagree with what the state has reported in terms of tests reported last week, which showed a 21% increase compared to the week prior.
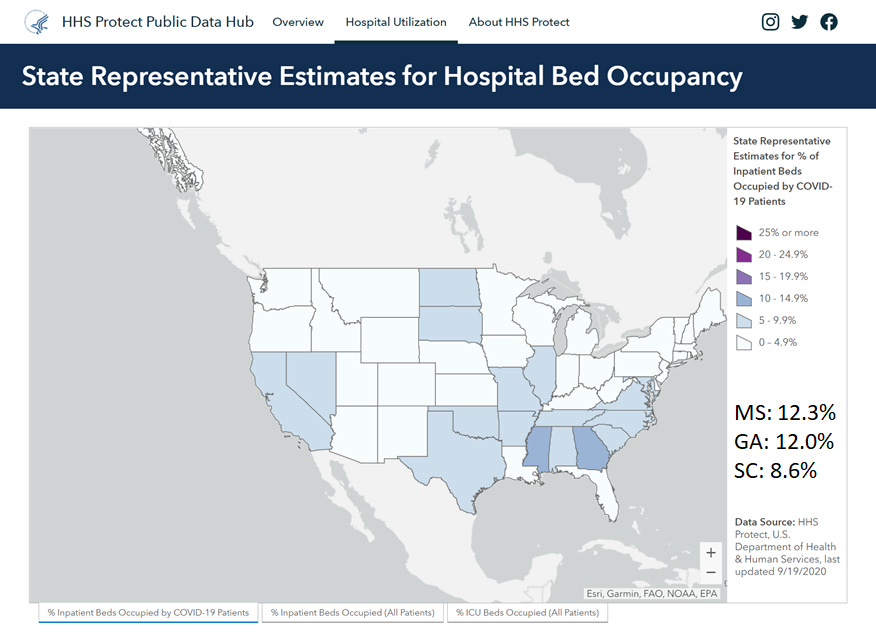
I have good news! Georgia has finally ceded the top spot in the country for COVID hospitalizations. After five weeks as the number one state in the nation, we are now #2 following Mississippi. The top three states are all southern states.
I haven’t posted this graph in a while, but here is what underlying conditions are most commonly identified among those who are hospitalized for COVID-19 symptoms.

Among adults, the top three conditions are hypertension, obesity and metabolic disease (includes diabetes). Among children, 50.9% have no underlying condition at all. For those children who do have underlying condition, the most common are obesity, neurologic disease and asthma. Pregnancy is associated with 27.8% of COVID hospitalizations. There are some new reports on pregnancy and COVID-19.
Among pregnant women admitted to a hospital (for COVID or obstetric reasons), 55% were asymptomatic. I was surprised by how many asymptomatic women had radiological findings (by X-ray and CT) that are also found in COVID-19. But the sample size for asymptomatic pregnant women was small (for good reason) and these women were likely sick enough for other reasons to warrant getting radiologic analysis while pregnant. Symptomatic women were more likely to have a caesarian section than asymptomatic women.
Rates of pre-pregnancy obesity and gestational diabetes were higher among pregnant women hospitalized for COVID-19-related illness compared to pregnant women who were admitted for other procedures (i.e. labor and delivery) who happened to test positive for COVID-19.
Despite our declines in the rankings for case rate (a good thing), we are still #10 in the nation for death rate per 100,000 in the past 7 days. Southern states make up 6 of the 10 positions on that list, I’m sorry to say.
Georgia
Here is how the state of Georgia is looking based on the risk tool from the Harvard Global Health Institute. The color coding is explained below the map.

There are some changes from last week that show us backsliding a bit. There are two green counties this week compared to four last week. There are 35 yellow counties this week compared to 45 last week. For yellow counties, there is community spread that might be manageable with adequate testing and contact tracing. These counties include some of our most populated ones such as DeKalb. However, the remaining 122 counties have such widespread disease that containment of the virus is not currently possible without a shelter in place order. There just isn’t enough testing or contact tracing to monitor or control disease spread. Instead, we need human behavior to play a role here such as mask wear, adhering to social distancing guidance, etc. Eventually, we could all get to that green or yellow category but it won’t happen by magic. We have to do the work.
For today, here are the net increases for each key metric for Georgia.
Testing: 20,041 new tests (mid-range for us), 15.7% were positive. 266.3% of today’s cases were identified through electronic laboratory reporting (ELR), so there are a lot of duplicate results in today’s report. The state counts tests regardless of whether they come from the same person in their calculation of percent positive rate - it is all positive tests divided by all tests performed (positive and negative). However, multiple positive tests from the same person are de-duplicated when case counts are tallied. So the case count is where the correction is made. Below you can see how the percent of cases reported through ELR. We have typically trended close to 100% but have seen more variability lately.

In addition, 43.7% of today’s cases were backdated prior to the 14-day window. Below you can see how backdating has varied over time. Ideally this should be 20% or less, but we’ve seen some increases lately. That big spike on 24Aug was the day of the Bibb County data dump that made headlines. Delayed reporting is unfortunately all too common in public health, which is why you see the disclaimers for it in nearly every figure legend and every article. Corrections due to delayed reporting are done in the graphs by date of symptom onset or date of death. You can see how these corrections are made over time by visiting this website. When we have delayed results like this, it means that there was more disease circulating in our communities than we previously realized.

Cases: 1184 cases (low end for us lately). The new statewide total is 307,339. Of today’s cases, 26.2% came from nonrural counties outside of the Atlanta metro. Another 25.8% came from the Non-Georgia Resident category. Rural counties accounted for 21.2% of today’s newly reported cases. Atlanta suburb counties contributed 16.2% of our cases and Atlanta counties contributed 10.6%.
Hospitalizations: 17 new COVID hospital admissions and 3 new ICU admissions (these are low numbers for Georgia). We typically see low numbers on Mondays due to delayed reporting over the weekend. There are currently 1421 COVID patients hospitalized and this number has held near-steady for the past four days. Adult ventilators are being used at 31% of our state’s capacity.
Something to celebrate today is that none of the state’s hospital regions are experiencing >90% usage of their ICU beds.
Deaths: 2 newly reported deaths (mercifully, a very low day for us). It should be noted that nursing homes typically do not report over the weekends, and Mondays tend to be low count days for this reason. Both of the newly reported deaths came from nonrural counties. The new statewide total is 6604.


The Georgia Department of Public Health began producing a new county indicators report that is available at the bottom of the daily report. Some things I like about it so far include the following:
It’s easier to sort and see the counties with the highest disease rates over the past 14 days, adjusted for population. With today’s report, many of these are rural counties, the exception being Clarke county (ranked #4 in the state).

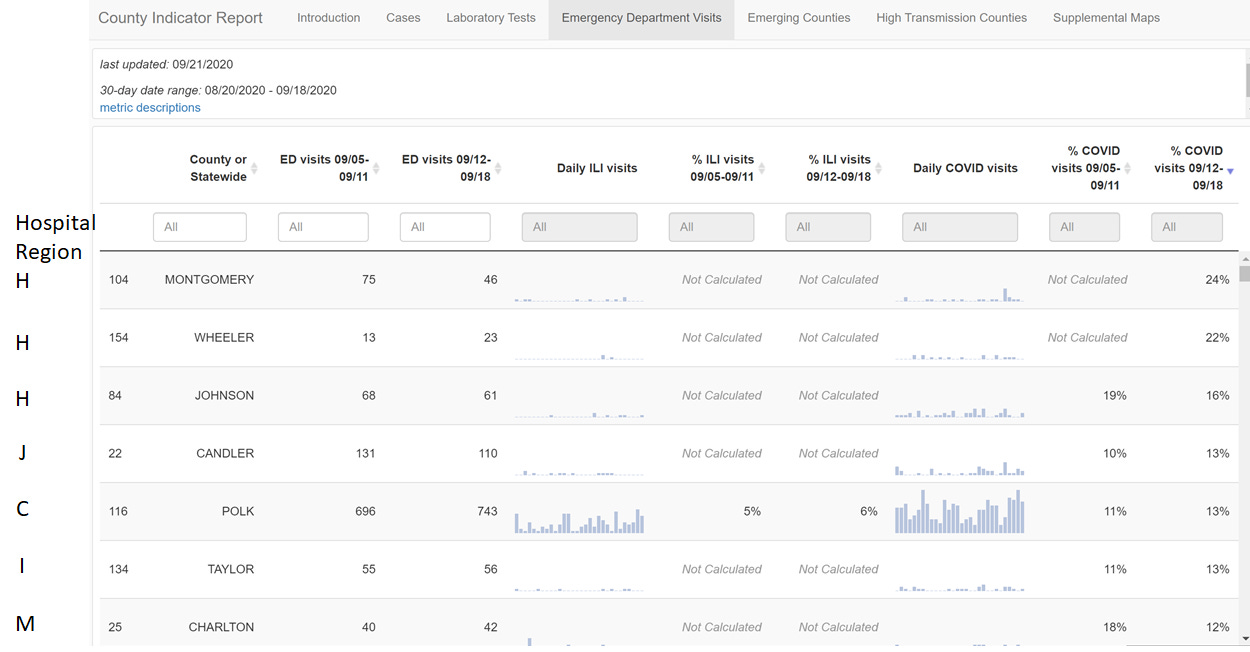
We now get data on emergency department visits per county. Below, I’ve sorted the counties so that the ones with the highest percentage of COVID visits in the most recent week are at the top. It should be noted that all seven of these counties are rural. For your convenience, I’ve added a column on the left that indicates which hospital region serves each county.
I have mixed feelings about the Laboratory Testing tab. I really like that we are getting test data in terms of total tests performed at a county level so that we can calculate tests performed per 100,000 people. But that data is something you have to click and identify through the 30 day graph and it is not readily available for analysis. So I’m relieved that these data are now available, but am disappointed that they aren’t easier to use.
Emerging counties and high transmission counties maps and tables. I REALLY like the tables that you can sort for each of these maps. For the example below, I’ve sorted the counties for being classified as an emerging county, experiencing a >25% increase in cases, >5% increase in COVID-19 emergency department visits and >10 cases in the current week. Using these criteria, I think we can better see what the highest risk counties might be. All but one of these counties (Floyd) are rural.


I’ll probably find more goodies in the new report over time and will share those in upcoming updates. The report is going to be updated weekly, according to the Introduction tab.
Have a great evening!
References
https://www.nytimes.com/interactive/2020/us/coronavirus-us-cases.html+
https://www.nytimes.com/interactive/2020/world/coronavirus-maps.html
https://globalepidemics.org/key-metrics-for-covid-suppression/
https://www.nytimes.com/interactive/2020/04/23/upshot/five-ways-to-monitor-coronavirus-outbreak-us.html
https://covid.cdc.gov/covid-data-tracker/#testing_testsper100k
https://dph.georgia.gov/covid-19-daily-status-report
https://covid-gagio.hub.arcgis.com/
https://amberschmidtkephd.substack.com/p/the-sunday-week-in-review-14-20sep2020
https://www.cdc.gov/mmwr/volumes/69/wr/mm6938e1.htm?s_cid=mm6938e1_w
https://www.cdc.gov/mmwr/volumes/69/wr/mm6938e2.htm?s_cid=mm6938e2_w
http://www.dshaver.org/covid/epicurveInteractive-cases.html
Georgia COVID-19 Updates is a free newsletter that depends on reader support. If you wish to subscribe please click the link below. There are free and paid options available.
My Ph.D. is in Medical Microbiology and Immunology. I've worked at places like Creighton University, the Centers for Disease Control & Prevention and Mercer University School of Medicine. All thoughts are my professional opinion and should not be considered medical advice.