

The Sunday Week in Review, 14-20Sep2020
Georgia COVID-19 Updates

Good afternoon! This is the week in review for the COVID-19 pandemic in Georgia for the week of 14-20Sep2020.
Testing
Of note, this month is Public Health Laboratory Professionals appreciation month according to the Association of Public Health Laboratories. You can learn more about the important (and diverse) work that public health laboratorians do all the time, with or without a pandemic with this helpful fact sheet. If you know someone who works in this field, in service to their community, please make a point to say thank you…and maybe buy them a cup of coffee. In my experience, laboratorians go through a lot of coffee. If you are a public health laboratorian reading this post, thank you so very much for the work that you continually do to serve our community, state, and nation.
Some good news to start us off is that our testing output is back up after a large decrease the previous week, increasing by 21%. And as tends to happen, when you look for disease with the case rate we have in Georgia, you’re more likely to find it. So our percent positive rate also increased over the past week.

Cases
The number of new cases (by date of report) is as follows:
- 24 hours: 1134 (+0.4%)
- 7 days: 11,841 (+4.0%)
- 4 weeks: 52,206 (+20.6%)
The new statewide total is 306,155 which means that of all the cases that have been recorded, 17.1% were reported in the past 4 weeks. That is a reduction compared to last week (19.5%). Bear in mind that these case totals are likely an under count of our actual case count - it’s a problem that plagues public health for multiple diseases and especially so when a disease has so many asymptomatic cases, as COVID-19 does. And these cases are those confirmed by the diagnostic PCR test. It does not include those who screen positive through other testing methods such as the rapid antigen test.
Below you can see how our 7-day case rate per 100,000 stands. The solid black line is the statewide average. I’m not sure if this is bad news yet. It could be normal variation before the trend continues downward. But it certainly isn’t good news. You can see that the state wide average case rate is starting to increase again. Every county type has either leveled off their decrease over the past month (i.e. nonrural and Atlanta suburbs) or has begun increasing again (i.e. rural and Atlanta counties).

We are about two weeks after the Labor Day holiday and that could be contributing to our new case increases. But honestly, it’s kind of difficult to discern whether it’s Labor Day alone or a combination of factors that also include the reopening of K-12 schools and colleges and universities. We need more time and more data on outbreaks from the state. They provided a report last week that described where outbreaks are coming from (a press release). Hopefully we get that information on an ongoing basis.
Also somewhat concerning is the increase in cases we are seeing among the Black / African-American population and a large increase in the “unknown” category. The unknown category is a holding area pending investigation by contact tracers. So seeing a large influx might be evidence of an increased workload for them. A note about interpreting this graph: each of the bars represents another week’s worth of data for that race category. So when you get to the next race, the timeline starts over.

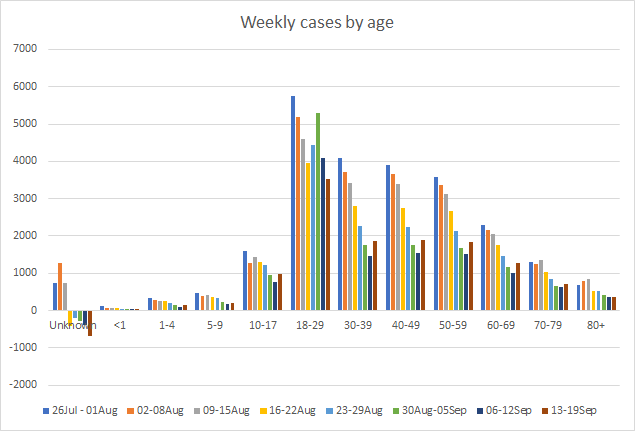
Cases are increasing across multiple age groups including 1-17 and 30-79. During the summer surge we saw increases first in the 18-29 year group and then it spread to older (and more vulnerable) age groups. That might be happening again, but it’s a little early to know that for sure. Like the race graph, each of the bars represents another week’s worth of data for that age category. So when you get to the next age group, the timeline starts over.
Hospitalizations
Here’s a look at how hospitalizations have varied among age group over time. We are seeing increases this week in all age groups. The increase is largest among 60-69 year olds. These are not good news items.
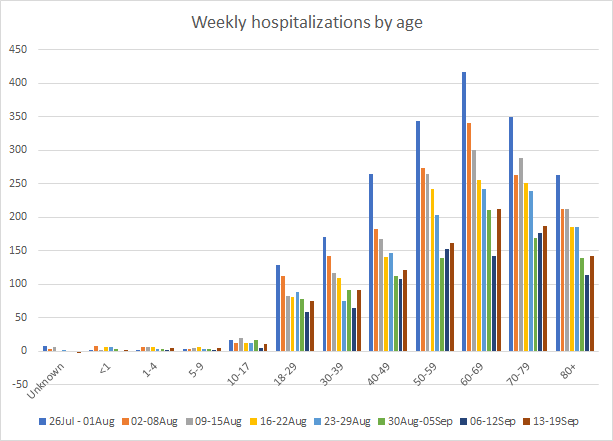
There were 1008 new hospital admissions this week, an increase over the 846 that were recorded for the week before. It is possible that we have hit the floor of our decrease in hospitalizations after the summer surge.
The good news is that there is only one hospital region that is using >90% of their ICU beds as of today - region C in west Georgia.
Deaths
The number of new deaths (by date of report) is as follows:
- 24 hours: 3 (+0.05%)
- 7 days: 269 (+4.2%)
- 4 weeks: 1470 (+28.6%)
Below you can see how the 7-day death rate per 100,000 has varied over time according to county type in Georgia. The statewide average is in the solid black line. Nonrural counties (those outside of the Atlanta metro with >50,000 residents) track right along with the statewide average but rural counties (those with <50,000 residents) have a rate that is 75% higher than the rest of the state. Again, the Atlanta metro is below the statewide average. Overall, the death rate is continuing to decline for the state, but the death rate is holding steady for Atlanta suburbs and increasing for rural counties.

As we did for cases, here’s how deaths have changed since August 1st for each race. Deaths decreased this week for every race except White and Native Hawaiian / Pacific Islander populations.

Below you can see how deaths compare week to week for each age group. Deaths are decreasing for most age groups, they increased this week for those 60-69 and those 80+.

The presence of an underlying condition may make a COVID-19 infection more complicated for the person with the condition. But I don’t want people falling into the belief that these people were going to die anyway - that’s not correct. Their condition may have been well managed prior to infection and/or had nothing to do with their death. Just be careful about thinking that these deaths are “someone else’s problem” because no one in your family has an underlying condition. Here’s the reason why in the graph below.

There have thankfully been relatively few deaths among 0-19 year olds. But among those who have passed, 88% had an underlying condition. Again, we don’t know whether that condition contributed to their death…it’s just noted. HOWEVER, pay attention to what is happening to the other age groups. Among 20-39 year olds, the majority of the people who died did NOT have an underlying condition. And even among the age groups with the most deaths (80+), only 57-61% of the deceased had an underlying condition.
Combined Data
We’ll wrap up with a look at how three of our most important metrics are comparing with one another: cases, hospitalizations and deaths. Cases are represented by the blue line (left y-axis) and hospitalizations and deaths are represented by the gray and red lines, respectively (both on the right y-axis).

Deaths continue to decline, albeit at a slower rate than the past week. However, cases and hospitalizations are increasing after 8 weeks of declines for cases and 7 weeks of declines for hospitalizations. This is not good news. However we aren’t powerless in this situation. Anything you can do to limit exposures will help to keep cases and hospitalizations down.
Wear a mask when you’re with people you don’t live with either in public or in a car.
Avoid unnecessary errands or find a way to minimize risks through curbside pickup, online ordering, etc.
GET YOUR FLU SHOT!!! We know co-infections are possible and we know that both infections can kill people all by themselves. We don’t have a vaccine yet for COVID-19 but we do for influenza. Let’s keep infections as uncomplicated as we can this fall.
If you’ve had a high-risk exposure, self-isolate and seek a test within 3-7 days after exposure. Then you need to continue to self-isolate until your test comes back (hopefully negative).
I know it’s hard to be here again with what seems like worrying signs of a possible increase after months of work to bring cases and hospitalizations down. We don’t know yet whether this will lead to a new surge. But we all have things we can do to avoid such an event. Please do those things.
References
https://dph.georgia.gov/covid-19-daily-status-report
https://covid-gagio.hub.arcgis.com/
https://www.aphl.org/aboutAPHL/publications/Documents/WORK-2020-PHL-Advocacy.pdf?fbclid=IwAR3ZsZAFLggil1Y4IqTnO-70RDvhwrQK2BE7vK_msu28eZ0I1qNIERyCk7g
Georgia COVID-19 Updates is a free newsletter that depends on reader support. If you wish to subscribe please click the link below. There are free and paid options available.
My Ph.D. is in Medical Microbiology and Immunology. I've worked at places like Creighton University, the Centers for Disease Control & Prevention and Mercer University School of Medicine. All thoughts are my professional opinion and should not be considered medical advice.