The Daily Digest, 17Mar2021
Georgia COVID-19 Updates

Subscribers, if you didn’t receive the email on Monday, you can read the newsletter here. I had a setting wrong when sending the email and only a fraction of you actually received it. My apologies.
By now I’m sure you have heard about the unspeakable violence that took place in Atlanta and Cherokee county yesterday that took the lives of 8 people, 6 of whom were Asian-American women. This newsletter is primarily pandemic-focused, but I can’t ignore things that are happening alongside all of this. I want send every ounce of love and peace possible to these families, their communities, and to so many friends and colleagues of Asian-American or Pacific Islander (AAPI) heritage. But I think we can do more than read news articles with disgust or post to social media to show solidarity. This is a time to support and follow the lead of AAPI community organizations and charities. Let them tell us what they need and then show up when they need us. Give them resources to conduct their vital work if you’re able. I’m linking to a few of those organizations below, but it is not an all-inclusive list and they are listed in no particular order or rank or preference.
Shifting slightly back to the pandemic, while still holding this community in mind, this pandemic has levied a heavy toll on our country not just in terms of lives lost but also businesses who have struggled or closed entirely. Many of you are those business owners and have relayed to me your anxiety and worry. For many, these stimulus funds are vital to paying rent, buying groceries and meeting basic needs. For those who were more fortunate through this pandemic, consider using these unexpected stimulus funds to support your local economy - your local restaurants, salons, stores, etc, that have been so hard it. Even if you feel unsafe eating in a restaurant or getting your hair cut, you can buy a gift card to spend later. But if you are in a position to do so, the two best ways we can help our communities right now are to get vaccinated as soon as we are eligible and support these local businesses and charities. If you need some suggestions for charities, consider those that support AAPI communities listed above.
We have the latest White House state reports that were finalized last Friday but released to the public yesterday. I’ll talk about Georgia-specific data and trends in the following sections but I want to talk about national numbers first.
For new case rate per 100,000
Top states: MO**, NJ, NY, RI, DE **result of antigen case data dump, don't panic.
28 states + DC in the red zone
Test positivity looks a LOT better than a month ago.
Top 5 states: NJ, NE, FL, TX, SD
17 states in yellow zone (5-7.9%).
There are NO STATES IN THE RED ZONE.
COVID-19 hospital admission rates per 100 beds.
Top 5: DC, MD, PA, GA, VA
1 state + DC in the red zone
COVID-19 death rates. Remember that deaths lag behind cases and hospitalizations. Things should improve soon.
Top 5: VA, OH, DE, CA, AR
26 states + DC in red zone
Vaccinations - as of last Friday, almost 1 in 5 Americans have received at least one dose of the vaccine (well done! Keep going!).
Top 5: NM, CT, AK, SD, ND
Bottom 5: PR, GA, DC, AL, TN
Vaccine Update
While we’re on the topic of vaccinations, yesterday Governor Kemp claimed that there was a data error that they had identified with people at CDC where 250,000 doses administered through the federal direct-to-pharmacy program weren’t accounted for in the CDC state-level data for Georgia as an explanation for why the state is consistently ranked last or nearly last in vaccine administration for weeks now. However, no data were provided to back up that claim and no data corrections have taken place in the CDC data. So I have a couple things to say about this. First, sort of like how people say “pics or it didn’t happen,” we need to see the data or it didn’t happen either. I think we’re all past the point of taking someone’s word for it when it comes to this pandemic. Bring the receipts with you and show your work. Second, the federal direct-to-pharmacy program exists in all states and US territories. So if this claim is correct, it’s possible that the US (and Georgia) is doing better than we previously realized. But if those corrections are made across all states, it would lift rates for all states. So it doesn’t really solve the problem of Georgia’s ranking. Nor does it really solve the enormous surplus of vaccines that the state has on hand. As of today, Georgia has used 65.7% of its available vaccine supply (#49 in US) and has >1.47 million doses on hand. Adjusted for population, Georgia is the #6 state for number of doses on hand and unused. This is a metric where you do not want to be in the top 10. And yet, five southern states make up the top 10. The data for the table below are available for download from the CDC daily. The four columns on the right are my additions. The population count comes from the Community Profile Reports from the US Department of Health and Human Services.
If we look at how well Georgia is doing at vaccinating its population compared to the national trend for first doses administered of all adults, then we can see that Georgia has always been below the national average. Not just that, but the disparity is widening and Georgia is falling further behind. The state can and should do more to correct this. The graph is similar if we look at those who are fully vaccinated.

Testing
For each of these sections, you’re going to see a graphic similar to what’s provided below. The map comes directly from the White House state report and gives us a look at where we are now. The graphs on the right are related to that same metric, but show us how Georgia and the US have trended weekly over time (where we’ve been). The graphic below all relates to testing.

For the map, you want to be in the green categories as much as possible. There are a couple dozen green counties here, but a lot of yellow too and a handful of red counties. Even still, this map looks so much better than it did a month ago. In the upper right, we can see how Georgia (blue line) has compared to the US (red line) for tests performed per 100,000 residents. Here too, you will see that Georgia has always underperformed relative to the national average. The lines tend to move in parallel, but right now testing is increasing nationally whereas it remains flat over the past couple weeks for Georgia.
Test positivity is shown over time in the graph on the lower right. The gray dashed line shows the WHO goal line (5%). The US is now below that goal line and Georgia is just above it (5.4%). However, the challenge becomes staying at or below that line for the long term. Test positivity is often considered alongside case rate to gauge how much the case rate might be an undercount of present disease burden. Seeing a test positivity rate at or below 5% means we are unlikely to be missing very many cases with the current level of testing.
Today, Georgia reported 22,721 PCR test results and 10,076 antigen tests. However, only 51% of today’s newly reported antigen cases were reported through Electronic Laboratory Reporting (ELR). So it’s possible that the antigen test total is actually quite a bit more than this. Of today’s PCR tests, 5% were positive. Of the antigen tests, 4.7% were positive but, again, these data might not be trustworthy today due to low reporting through ELR.
Cases
Case rate per 100,000 is improving a lot compared to where Georgia has been in the recent past. For the map, it’s best to be in the yellow or green categories and we see a handful of yellow counties. There are still a couple dozen red zone counties and a lot of them are clustered around the Atlanta metro.

If we look at where we’ve been (on the upper right), we can see that Georgia’s case rate has continued to decline after a brief plateau. In fact, the Georgia case rate is now less than the national case rate! Hopefully case rate continues to decline for both the state and the nation. The graph on the lower right shows skilled nursing facilities that have at least one COVID-19 case each week for Georgia (blue) and the US (red). Georgia has matched the national rate and did so much faster than the US trend. A lot of this may be due to the vaccination effort that was initially targeted at patients and staff at these kinds of facilities, but it also matches the broader trends of the state.
Today, Georgia reported a net increase of 1127 newly reported PCR cases and 917 antigen cases, for a combined total of 2044. This is the highest total we’ve seen in about 10 days, but I wouldn’t get too anxious just yet. Remember, we want to pay attention to trends rather than single-day data points. We are getting close to doing something Georgia has never done before - returning to pre-surge baseline. The 7-day case rate per 100,000 is about 24% above the pre-winter surge bottom.

Hospitalizations
Much of Georgia is now in the green zone for hospital admission rate for COVID-19 - certainly welcome news. There are clusters of red counties along a diagonal from Troup county to Northeast Georgia. There is another cluster in the southwest corner of the state. But otherwise, things are looking really good.

On the upper right we can see how this metric has moved over time for Georgia and the US, since Thanksgiving when HHS began providing these data to us. It looks like Georgia rebounded in the past week but I think this is an artifact due to poor reporting to HHS in the previous week. Don’t panic. In the lower right, we can see how intense ventilator use was for COVID-19 patients during the winter surge. At its peak, COVID-19 ventilator use in Georgia was 138% higher than the national average.
But things are getting so much better for Georgia now. In fact, if we look at the number of patients currently hospitalized for COVID-19, the state is very close (14 patients away) to its pre-surge bottom. If we get there, it will be the first time Georgia has done so in the pandemic. In the past, we’ve seen this trend where we bottom out of a surge at a higher level than where we entered the surge. That set us up for bigger peaks in subsequent surges. So seeing us get back to baseline AND knowing more and more people are getting vaccinated is fantastic.

But we need to see this through to the end. Let’s work together to make the winter surge the last one that Georgia experiences. Keep up on those non-pharmaceutical interventions (masks, social distancing, etc) and get vaccinated at your earliest opportunity.
The only piece of not-awesome data for hospitalizations in Georgia today is that we had a higher ICU admission count than we’ve seen in 12 days. But again, we should not panic over single-day data points. Let’s see if this becomes a larger trend before we get worried.
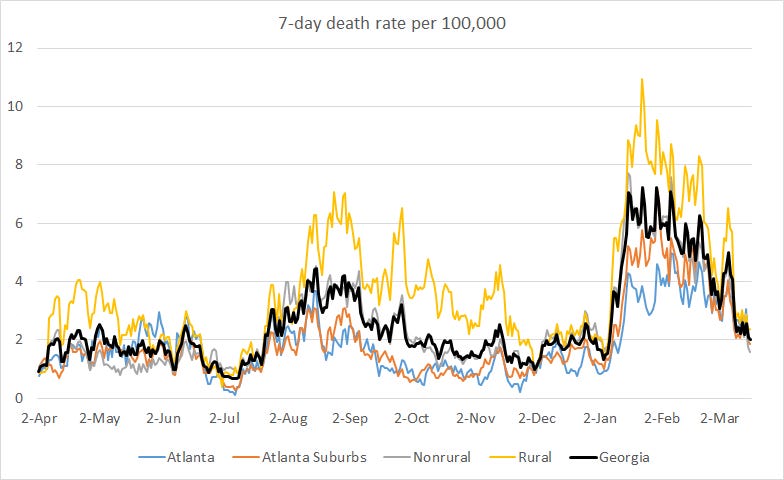
Deaths
Deaths are a lagging metric compared to cases and hospitalizations. By this, I mean that there is a delay in deaths compared to the surges in cases and hospitalizations that feed into death surges. As a consequence, there is also a delay in when the surge recedes for deaths too and we are still on the downhill from that now. So whereas the maps all showed a lot of green and yellow for the other metrics, the Georgia map for death rate remains largely red. We will get there.

The graphs on the right show just how much better Georgia is doing now compared to the peak of the winter surge. The state has almost caught up to the national death rate (upper right) and a similar trend is observed for skilled nursing facilities with at least one COVID-19 death (lower right). It’s not a perfect comparison because we’re measuring slightly different things, but notice that there was a plateau in case rate at the top of the surge (upper right) but deaths dropped off right away for skilled nursing facilities. This is one way to see the early success of the vaccine, since this population was prioritized for vaccinations early on.
Georgia reported a net increase of 69 newly reported confirmed deaths and 3 probable ones. Despite this, the death rate continues to decline. At this point, the 7-day death rate for the state is 31% above the pre-winter surge baseline.
References
https://dph.georgia.gov/covid-19-daily-status-report
https://covid-gagio.hub.arcgis.com/
https://beta.healthdata.gov/browse?tags=covid-19-spr
https://covid.cdc.gov/covid-data-tracker/#vaccinations
https://www.ledger-enquirer.com/news/coronavirus/article249983709.html
https://beta.healthdata.gov/Health/COVID-19-Community-Profile-Report/gqxm-d9w9
Georgia COVID-19 Updates is a free newsletter that depends on reader support. If you wish to subscribe please click the link below. There are free and paid options available.
My Ph.D. is in Medical Microbiology and Immunology. I've worked at places like Creighton University, the Centers for Disease Control & Prevention and Mercer University School of Medicine. All thoughts are my professional opinion and should not be considered medical advice.
It was bad when GA was last in vaccination rates because the Governor over allocated vaccines to rural GA vs. metro Atlanta. It's downright immoral that the gap is widening. If there's a problem with the data, why can't they just fix it to get close to a better proxy so that they can simply solve the problem?? How do you make the case that they're neither incompetent nor corrupt?