

The Daily Digest, 09Sep2020
Georgia COVID-19 Updates

Good evening! This post is going up late today because there is so. much. to. discuss. It has taken more time than usual to consider what needs to be shared and what might be okay to wait until Friday.
I was able to find the latest White House Coronavirus Task Force report for Georgia today from the Center for Public Integrity. I’ll discuss the report throughout today’s post.
Here is the summary table from the report.

Another bit of news: some of the data feeds that supply the Georgia Geospatial Information Office data hub are down and from conversations I’ve had, they may not be coming back for some time. It is definitely impacting the top dashboard that is another representation of the daily report from the Department of Public Health. It is still showing yesterday’s data as current. The thing about web development is that it requires maintenance and upkeep and that takes money. So it’s a bad time for the State of Georgia’s COVID-19 Data Task Force to be out of money. I’ve had a pit in my stomach since learning of this because depending on how many of the dashboards are impacted, we may be flying blind for data. And since we now rely on this hub for data on hospitals, it means the public doesn’t have access to key information. I had just uploaded a video walk through of how to navigate the hub, too.
Testing
Today I have a little bit of good news / bad news. The good news is that our percent positive rate is that percent of today’s new test results that were positive is 6.8%. The bad news is that it is likely not a reliable representation of testing because only 55.8% of today’s cases came through Electronic Laboratory Reporting (ELR). So the remaining ~44% of cases were reported through phone, email, fax, etc. When so few of the cases are reported through ELR, that means that we probably don’t have a representative percent positive rate.
Through ELR, there were a total of 15,953 tests reported today, which is a low output day for us. When we aren’t looking for the disease, we are less likely to find it. So it’s really important that we be doing more testing, rather than less, and ESPECIALLY as K-12 and college and university settings are back to face to face instruction in parts of the state. Because the virus doesn’t care too much whether we know who is positive. But when we don’t know, it makes it harder for us to halt the spread of the illness.
Of the results that were reported today, 15.8% were backdated prior to the 14-day window, which is pretty typical for Georgia.
Next, let’s compare Georgia to the US for testing per population from the White House Coronavirus Task Force (WHCTF) report.

Georgia has always been below the national average, at least, since the WHCTF reports have been made available to the public. I mean, one could justifiably argue that they should all be available to the public but that’s a discussion for another day. While we have come closer to the national average in recent weeks, we diverged further this week.

Meanwhile, we have a higher percent positive rate than the US average, again we always have, but have come closer to matching the national average in recent weeks.
Cases
There was a net increase of 1937 newly identified cases with today’s DPH report. It brings the statewide total to 287,287. Of the new cases, 39.5% came from nonrural counties, 27.2% came from rural counties, 23.3% came from the Atlanta suburbs and 8.9% came from the Atlanta counties. Nonrural counties are those with >50,000 residents that are not part of Atlanta or its suburbs. You may recall that I used to track the counties that had >50% increase over the past 2 weeks. Most Georgia counties fell off of that list when the cases declined after the summer surge. However, two counties popped back on it today - Clarke and Bulloch counties with increases of 52.7% and 56.5%, respectively.
The next two graphs show the case curve by date of symptom onset for Clarke and Bulloch counties. Pay attention to what is happening in the window of uncertainty. Remember, the cases in the 14-day window of uncertainty may go up with additional reporting, but rarely go down in a large way.
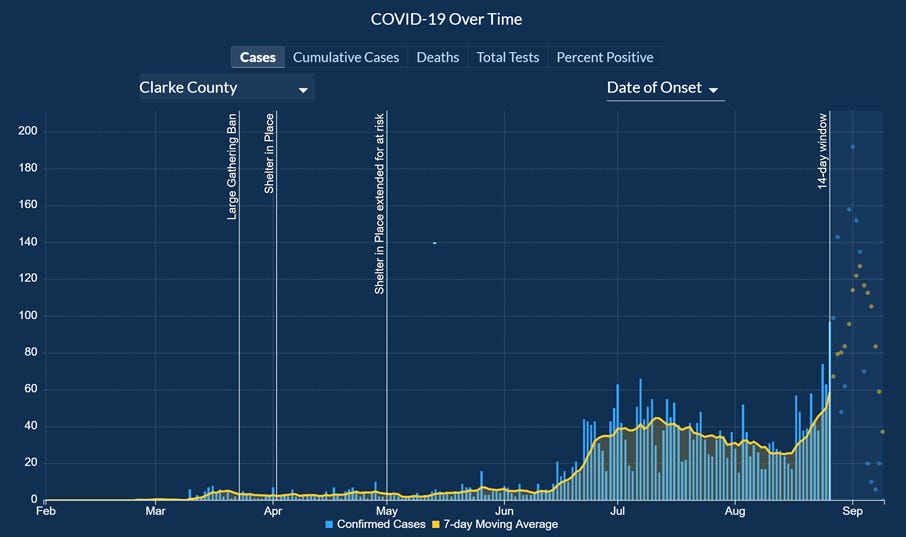

Both of these counties show would looks like exponential growth. The increase is sharper than the previous surges that Bulloch county has experienced. The cities of Athens and Statesboro are on the top 10 cities for case rate per 100,000 from the post I wrote on Monday. They also host large universities.
Today the University of Georgia posted new data for last week. The case increase they are seeing is stunning, with 1417 cases reported last week alone. And since this report relies on self-reported data as well as on-campus testing, it is likely an under count of the cases.

In addition, they are experiencing an 8% positive rate among their surveillance testing. According to one professor at UGA, their acute care testing (through student health) has a 50% positive rate. So…cases are escalating rather quickly and there isn’t enough testing being done to even keep track of it, let alone contain it.

Meanwhile, Dr. Frick also points out that Clarke County School District remains fully online, waiting for case rates to drop below 175 cases per 100,000 (assuming this is 14 day rate). Currently the case rate for Athens-Clarke county is 1337 per 100,000 residents. So I would anticipate that it will be hard to meet that benchmark any time soon.
Here’s what the 7-day case rate per 100,000 shows for each county type over time. The average for the state of Georgia is in the solid black line and it is based on date of report. Since the decline of the summer surge, you’ll notice that rural and nonrural counties remain above the state average. All county types are declining for now.

Here’s how things look for cases for Georgia compared to the US.

We were well above the national average during our summer surge. But things have narrowed in recent weeks. Still, we have a case rate of 132 per 100,000 whereas the US has a rate of 88. We are 50% higher than the national average. But hey - that’s better than twice the rate, where we were just a month ago.
There are 18 cities and 58 counties in the red zone. Another 19 cities and 61 counties are in the yellow zone according to the WHCTF.
Hospitalizations
Hospitalizations continue to decrease. As of today, there are 1485 patients currently hospitalized for COVID-19. This is far below our peak in July, but still about 675 patients higher than where we were on 13Jun, before the summer surge began. We remain at a very high level, so please be smart.
From the WHCTF report, here’s how hospitalizations compare between our state and the US. Note that the hospitalizations are graphed according to the left y-axis. The percent of hospitals reporting (gray line) is graphed according to the right y-axis.

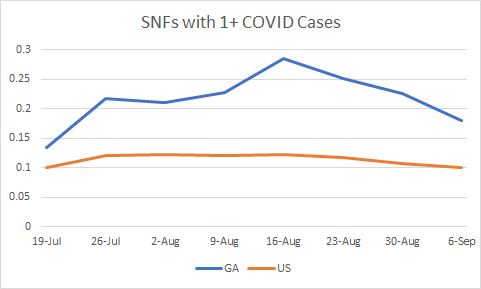
Similarly, here is how Georgia compares to the US with respect to skilled nursing facilities with at least one COVID positive resident.
Deaths
There was a net increase of 58 deaths today, bringing the statewide total to 6128. The case fatality rate has settled at 2.13% for the past four days. Of today’s deaths, 45% of them came from nonrural counties. The next highest category was rural counties with 15 deaths (or 25.9%). As you can see from the graph below, rural counties have been hit particularly hard by both our spring and summer surges. The Atlanta metro is below the state average. Note, this graph is based on date of death report.

We continue to be at twice the death rate per 100,000 compared to the national average according to the WHCTF report. And our proportion of skilled nursing facilities with at least one COVID death is more than twice the national average. We are not doing enough to keep this disease out of nursing homes.
Finally, here are some of the top recommendations from the WHCTF report. I’ve highlighted a few areas of importance.

First, let’s start with what’s NOT recommended right now - a mask mandate. That’s something that’s been part of their recommendations for months now. I’m not sure if the omission was accidental or intentional. Instead, they are very focused on what is happening at colleges and universities, recognizing that they might be our biggest risk factor right now for community transmission. Among their recommendations for colleges and universities, they also recommend that these higher education institutions recruit college students to help carry public health messaging and EXPAND CONTACT TRACING CAPACITY. Meaning, hire students to be contact tracers. Many colleges and universities have been reluctant to do their own contact tracing, preferring to defer that responsibility to the Department of Public Health, citing FERPA although that seems to be an argument that the WHCTF doesn’t agree with. As I’ve discussed before, the contact tracing staff at DPH has their hands full as it is, without us adding more cases to their workload. If colleges and universities want to remain open they need to be doing all within their power, including in-house contact tracing, to limit the spread of disease on their campuses. And if students want to continue to have this experience in class and (possibly) away from home, then they need to be smart in this too. Wear your masks, keep your gatherings small - 10 people or less. I would advise against going to bars and big indoor parties. The last thing that’s really interesting and kind of unusual is that the WHCTF is recommending a specific manufacturer and platform - the Abbott BinaxNOW. When I worked for the federal government and in my life as a military spouse, we had to be very careful about endorsing or not endorsing a product. Disclaimers abounded saying “no endorsement intended.” The technology is cool as a screening mechanism, but we can’t use it to confirm cases and it just made me double-take to see the federal government recommending a specific platform compared to all of the other tests and manufacturers that are out there.
References
https://amberschmidtkephd.substack.com/p/the-daily-digest-07sep2020
https://dph.georgia.gov/covid-19-daily-status-report
https://www.uhs.uga.edu/healthtopics/covid19?fbclid=IwAR0DY-qjzKUxO_8ef8kPnYCzuAFv57w6rvZSsMrWo2T3vrnZtJrXgx-6MBo
https://www.clarke.k12.ga.us/domain/2572
https://www.documentcloud.org/documents/7204532-Georgia-9-6-20.html
https://covid-gagio.hub.arcgis.com/
Georgia COVID-19 Updates is a free newsletter that depends on reader support. If you wish to subscribe please click the link below. There are free and paid options available.
My Ph.D. is in Medical Microbiology and Immunology. I've worked at places like Creighton University, the Centers for Disease Control & Prevention and Mercer University School of Medicine. All thoughts are my professional opinion and should not be considered medical advice.