

The Daily Digest, 09Apr2021
Georgia COVID-19 Updates

The elephant in the room: B.1.1.7
I’ve been doing a lot of public speaking this week to various organizations and as people ask me to make predictions about what happens next with the pandemic in Georgia, I find that I’m saying a phrase over and over again: we are more lucky than good. Let me explain what I mean by that.
The funny thing about pandemics is that humans don’t get to unilaterally decide when they’re over. Viruses don’t respond to tough talk or premature declarations of victory. Viruses get a big say in when the pandemic is over too, and they still have a lot of tools at their disposal. We find ourselves right now in a tug of war with the virus. On our side, we have vaccines that are incredibly effective (but not enough administered yet) and non-pharmaceutical interventions. Among the strengths the virus still has on its side are things like high community transmission rates (albeit lower than we experienced in January), more transmissible variants, off the charts pandemic fatigue, and disinformation and politicization of the pandemic. You’ll notice that the last two of those tools are things that humans are freely giving away to the pandemic.

In other words, we are fighting ourselves as much as we are fighting the virus. We should stop hitting ourselves. As much as we want to go back to life as normal, we still need to follow public health guidance as much as possible right now.

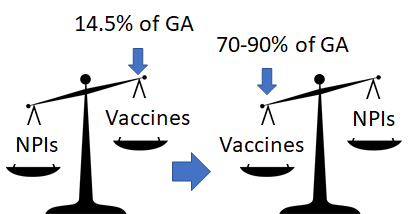
Be that as it may, because only about 14.5% of the Georgia population is fully vaccinated (CDC/HHS calculation), we still rely heavily on non-pharmaceutical interventions to interrupt disease transmission. These are the things everyone is tired of doing - wearing masks, social distancing, good air ventilation, staying home when you have symptoms, and exercising good cough and hand hygiene. But until we vaccinate more people, they’re the best tool we have - and they work! As we get closer to herd immunity, with at least 70% of people with immunity through vaccination or natural infection then we rely less on the non-pharmaceutical interventions (read more on why those previously infected need a vaccine too). But we aren’t there yet. We aren’t even close.
The virus is making a play here too and that is through the emergence and dominance of a more transmissible variant. Today, I’d like to focus on the variant called B.1.1.7 that first emerged in the United Kingdom. It is estimated to be 50% more transmissible than the version of the virus we have previously encountered. What does that mean? Let’s say that a person who was infected with the original strain was likely to infect 2 more people. If a person is infected with the B.1.1.7 variant, they are likely to infect 3 more people. Since that likelihood is the average for each infected individual, you can see that infections can escalate really quickly.
The New York Times has been doing some EXCELLENT work on data visualizations to help us see the effects of the B.1.1.7 variant. The graphic below is a still image of an animation that helps you to see how the B.1.1.7 emerged and then become dominant throughout Europe over time. You can click here or on the image itself to see the animation.

In the United States, we don’t have a robust genomic surveillance system to detect these variants like they do in Europe. Testing here is skimming the surface of how much of a particular variant is out there. But what we do see is concerning. Through mid-March, variants of concern or variants of interest had become 50% of the circulating virus lineages in the US, according to the CDC.

According to CDC data, there are 7 states where the B.1.1.7 represents more than 20% of the variants detected. In rank order, they are Michigan (39%), Florida (34.5%), Tennessee (35%), Minnesota (25.5%), New Jersey (22.8%), Georgia (22.1%), and Maryland (20.4%). So Georgia is #6 in the country for this but two of its neighbors (Florida and Tennessee) have even higher rates. And viruses don’t stop at the border. The map below shows us levels of community transmission by county. I’ve labeled the states based on their ranking for B.1.1.7 proportion of all variants detected.

Next, let’s look at how the B.1.1.7 variant has risen in comparison to recent case rate beginning with Georgia. I’ve blown up the image so we can get a sense for how the graphs look. Afterwards, we’ll compare states and trends. On the left you can see how cases of B.1.1.7 have risen in the months of February and March as a percentage of cases studied. Note that there’s a difference here between the CDC number and the Helix/NYTimes number. These are estimates by Helix (the genomic surveillance company) based on how many samples they’re testing compared to all available samples and what they found among those they tested. The graph on the right overlays the data on the left against new case rate per 100,000. What we can see is that even though case rate is flat in Georgia in the past couple weeks, B.1.1.7 is estimated to represent the majority of those cases.

Now let’s compare Georgia (bottom right) to some of the other states. The graph on the left for Georgia looks strikingly similar to the blue graphs for Michigan and Minnesota, and both of these states are almost completely in the red zone for community transmission right now (see map above). Case rates are rising for Michigan and Minnesota, even as they have fully vaccinated 20.4% and 22.8% of their population, respectively. Again, even though the vaccine rollout is getting better every day nationally, we still haven’t vaccinated enough people yet to prevent these surges. Remember, Georgia is at 14.5% for this metric.

So like I said, Georgia may be more lucky than good. I worry that it is only a matter of time before we see B.1.1.7 drive Georgia case rates upward and fast. The additional worry is that often we won’t see that a surge has begun until a week or two later. By that time, the virus has a lot of momentum and it takes more work for us to bring it to heel.
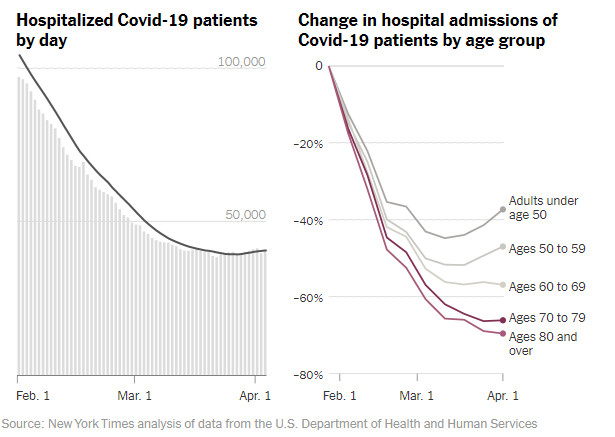
So what does this mean for hospitalizations? When vaccinations first became available, they were prioritized for healthcare workers and long term care facility residents. After that, the priority for states was vaccinating people by age group, starting with the oldest residents and working progressively to younger age groups. Nationally, the number of COVID-19 patients hospitalized each day is beginning to increase, albeit slowly (graph on the left, below). However, there is a really big difference in *who* is being hospitalized. In the graph on the right below, you can see that hospitalizations have been dropping for all age groups from early to mid February. But then we see a divergence, where the vaccine is clearly keeping hospitalizations among 70+ residents low, less so for those 60-69. But the hospitalizations we’re seeing now are among younger people, increasing for everyone 59 and under. These are likely people who hadn’t had the opportunity yet to be vaccinated by the time they contracted the virus. With more hospitalizations, deaths are likely to follow. But because the hospitalizations are mainly among younger adults, the deaths we are about to experience will be among younger populations. Instead of mourning the deaths of grandparents, a lot of these will be parents. The variant and its effects make the push to vaccinate as many people as we can, as fast as we can, even more important.
So as I said above, we’re in this tug of war with the virus. Right now, we need as many of us tugging in the same direction as possible. This vaccination effort is the biggest group project that any of us have ever been a part of and it’s a group project that we need to get right. So if you’re not vaccinated, please make that appointment to do so today. If you have been vaccinated, reach out to at least five people today to ask them if they need help getting to a vaccine (registration, transportation, childcare, etc). Then reach out to five more tomorrow, and so on.
Adolescent vaccines
Last week, I talked about a press release from Pfizer-BioNTech indicating that they were preparing to request EUA for their COVID-19 vaccine for 12-15 year olds. Today they followed up with the formal announcement that they have requested that expansion with FDA. If the past trends are repeated here, we might expect the Vaccines and Related Biological Products Advisory Committee to meet to review the data and make a recommendation to FDA in about 3 weeks. Then FDA would potentially expand authorization in the following days. Lastly, the Advisory Committee on Immunization Practices (ACIP) would meet to discuss special considerations when it comes to vaccinating 12-15 year olds. All told, we could have a vaccine for 12 - 15 year olds as early as mid-May.
Something to keep in mind - a lot of kids have fallen behind on their pediatric vaccination schedule due to the pandemic. You can see the recommended pediatric schedules here. Please get in touch with your child’s healthcare provider or your health department to get them up to date on their vaccinations. The very last thing we need on top of COVID-19 is an outbreak of measles, pertussis, etc.
Georgia Trends
Testing
Today Georgia reported a net increase of 17,823 newly reported PCR tests and 9925 antigen tests. Of the PCR tests reported, 4.9% were positive. For the antigen tests, 5.5% were positive.
Cases
There was a net increase of 1005 newly reported PCR cases and 436 antigen cases for a combined total of 1441. The 7-day case rate for the state is about 10% above the pre-surge baseline. Red zone counties are clustered mostly in the northwest corner of the state and this is the area we want to keep an eye on because COVID-19 hospital patient census is rising there too.

Hospitalizations
Today the state reported a net increase of 89 new COVID-19 hospital admissions and 20 admissions to the ICU. As I mentioned in the cases section, hospitalized COVID-19 patients are rising for hospital region A in the northwest corner of the state. What we don’t know at this point is whether these increases will continue or how high they will go.

Region A is in the red zone for COVID-19 patient census. Region F (middle Georgia) has now joined Region N (NW Atlanta suburbs) in the orange zone. Two weeks ago, all the regions were in the green or yellow zones. Now we have three regions in the higher categories. Make good decisions, readers.

Deaths
Today there was a net increase of 44 newly reported confirmed COVID-19 deaths and 6 probable deaths. If you combine confirmed and probable deaths, the state is now at 19,424 deaths associated with COVID-19. To put that into perspective, there were 44 deaths in Georgia linked to seasonal influenza in the 2018 - 2019 season, the last complete season we had before COVID-19 emerged.
So, in closing, I encourage you to make good choices. If Georgia is more lucky than good, I don’t want you to be impacted when the state’s luck changes. Be safe and be well!
References
https://www.nytimes.com/interactive/2021/04/06/us/variants-cases-spread.html
https://www.nytimes.com/interactive/2021/04/09/world/europe/europe-coronavirus-variants.html?action=click&module=Spotlight&pgtype=Homepage
https://www.cdc.gov/coronavirus/2019-ncov/cases-updates/variant-proportions.html
https://covid.cdc.gov/covid-data-tracker/#county-view
https://dph.georgia.gov/covid-19-daily-status-report
https://dph.georgia.gov/epidemiology/influenza/flu-activity-georgia
https://covid-gagio.hub.arcgis.com/
https://covid.cdc.gov/covid-data-tracker/#vaccinations
Georgia COVID-19 Updates is a free newsletter that depends on reader support. If you wish to subscribe please click the link below. There are free and paid options available.
My Ph.D. is in Medical Microbiology and Immunology. I've worked at places like Creighton University, the Centers for Disease Control & Prevention and Mercer University School of Medicine. All thoughts are my professional opinion and should not be considered medical advice.
Quote from a CNN article on 9 April 2021-- "In addition, real world studies of the Pfizer-BioNTech and Moderna vaccines show they are only 90% protective against the coronavirus, not 95% as reported in clinical trials. Translated into reality, that means for every million fully vaccinated people who fly, some 100,000 could still become infected." (How to fly safely a year into the pandemic)
Unless my own brain has gone blank, that assumes that if 1 million unvaccinated people fly, 1 million of them will catch COVID-19. I thought their other reported numbers looked more likely, but if the person writing this doesn't get what the 90% means....
How can we address this kind of misuse or misunderstanding of statistics and epidemiology? I've looked for a way to contact CNN with no luck.
Dr. Schmidtke, thank you so much for today's update! I've been watching the counties up here in Northwest Georgia, ours is Whitfield, and those surrounding us to the east and west and north-not so much the south of us yet-but the last two weeks, I've been able to see a day by day difference. I hadn't been keeping my case count since March but the hospitalizations and death numbers up here have been concerning for some time. We realized this week how bad our ICU situation had gotten again here in Region A. Counties are ticking up that are very rural and really shouldn't be rising unless something new was happening.
I know you must be getting tired of the pandemic. Listening to the latest TWIV episode, even the esteemed host of TWIV is ready to begin moving on from Sars CoV-2. Please know how much we appreciate your insights and ability to help us see the bigger picture. My husband, Blaine, reads your posts as often as he can and they are crucial in his ability to keep abreast of what is happening on the ground so that he can share that information with his patients and can understand this virus that we are all so weary of but that does not yet seem to be weary of us.