The Daily Digest, 02Dec2020
Georgia COVID-19 Updates

Yesterday we marked the one year anniversary of the first COVID-19 diagnosis in a patient. In that time scientists have isolated the virus, sequenced its genome and developed several vaccines, three of which are under consideration for emergency use authorization by the FDA. That’s pretty remarkable, an explosion of technology, science and commitment.
We’re going to talk about vaccines, how they work, and what to expect from these vaccines in the coming weeks. But because we have the latest edition of the White House Coronavirus Task Force (WHCTF) report to discuss, I’ll keep today’s vaccine discussion brief. Yesterday, the Advisory Committee on Immunization Practices recommended the following priorities for the first doses that will become available (see image below). The goal underpinning this recommendation appears to be preventing death and preserving hospital capacity by preventing staff shortages. Eventually, doses will likely be available to anyone who wants them, but we don’t have a timeline on when expanded eligibility will begin.

This week’s WHCTF report has stark warnings, not just for Georgia but nationally too. The language is the most direct I’ve seen in months. Special thanks to Scott Trubey of the Atlanta Journal Constitution for sending me a copy. You can read the report in its entirety here.

In case it’s hard to read those recommendations, we are in a very dangerous position right now due to strain on hospital capacity, impacting more than just COVID-19 care. If you are 65 or older or have underlying medical conditions, you need to effectively shelter in place and have groceries and medications delivered. If you are under 40 and attended a Thanksgiving gathering beyond your immediate household you need to assume you are infected and understand that you are a danger to others right now. Please self-quarantine and seek a test this week. Like I said, they’re very direct this week. But I think we need that leadership and guidance right now. Here’s the summary table for Georgia. Keep in mind that case data in this table and report do not include antigen cases, since Georgia has elected not to provide that data to USAFacts.org. That website is the data source for the WHCTF.

Testing
It’s important that we remember that our 7-day rates for cases and tests are going to look weird this week, because of the holiday last week. When most laboratories were closed for 4 of the 7 days in that calculation, you can imagine the impact that has on our numbers. So while the numbers look flat this week, understand that is the best case scenario. If those numbers reflect only 3 solid reporting days in that 7-day calculation, then it likely was a pretty big week. This will especially impact the DPH weekly numbers this week. However, the WHCTF report covers testing between 19-25Nov, or the day before Thanksgiving. So its numbers are NOT impacted by the holiday delay, at least for testing. As a result, we should expect next week’s report to have the holiday + weekend effect problem.

The Georgia test rate per 100,000 residents increase slightly in the past week, but remains far below the national average. The WHCTF implores Georgia to do proactive weekly testing of groups in our communities such as teachers, college students, county workers, staff in congregate settings, hospital personnel and large private sector employers. You can’t find disease when you’re not looking for it.
Georgia is ranked 37th in the nation for PCR test positivity, in the orange zone. For this, we are seeing an apples-to-apples comparison among states, considering that the metric is specific to PCR. Our test positivity looks flat compared to the previous week and the rate is decreasing for the US. Again, the WHCTF test data cover the week leading up to Thanksgiving, but not including the holiday. As a result, we should expect next week’s report to look very strange, indeed.

In today’s report from Georgia DPH, it was an average day for test output (23,997 new PCR tests reported) but a lot of them were positive today - 14.4%. This is the highest positivity rate we’ve seen since 30Sep. We need to be careful about putting too much emphasis on a single day’s positivity rate. It’s better to pay attention to trends over time, due to the way that test output ebbs and flows day to day. However, the positivity rate has been increasing steadily over the past week, so it’s not a weird number for us to see. Only 10.7% of the day’s newly reported PCR cases were backdated prior to the 14 day window of uncertainty, within normal limits. So the cases identified in today’s report are recent.
Cases
This week’s report indicates a plateau of case rate for both the state and the country. The WHCTF considered cases from 21-27Nov, so Saturday through Friday of last week. As I discussed in the testing section, though, this represents the best case scenario, with 2 days’ worth of poor reporting in the 7-day rate calculation due to the holiday. The case rate for both the state and the nation is likely higher than we see here. Georgia is ranked #48 in the nation for new case rate per 100,000 but I’m not real confident in that ranking either, both because of the Thanksgiving reporting problems, but also because Georgia has decided not to provide antigen cases in their case total to the WHCTF by way of USAFacts.org, whereas most states do so.

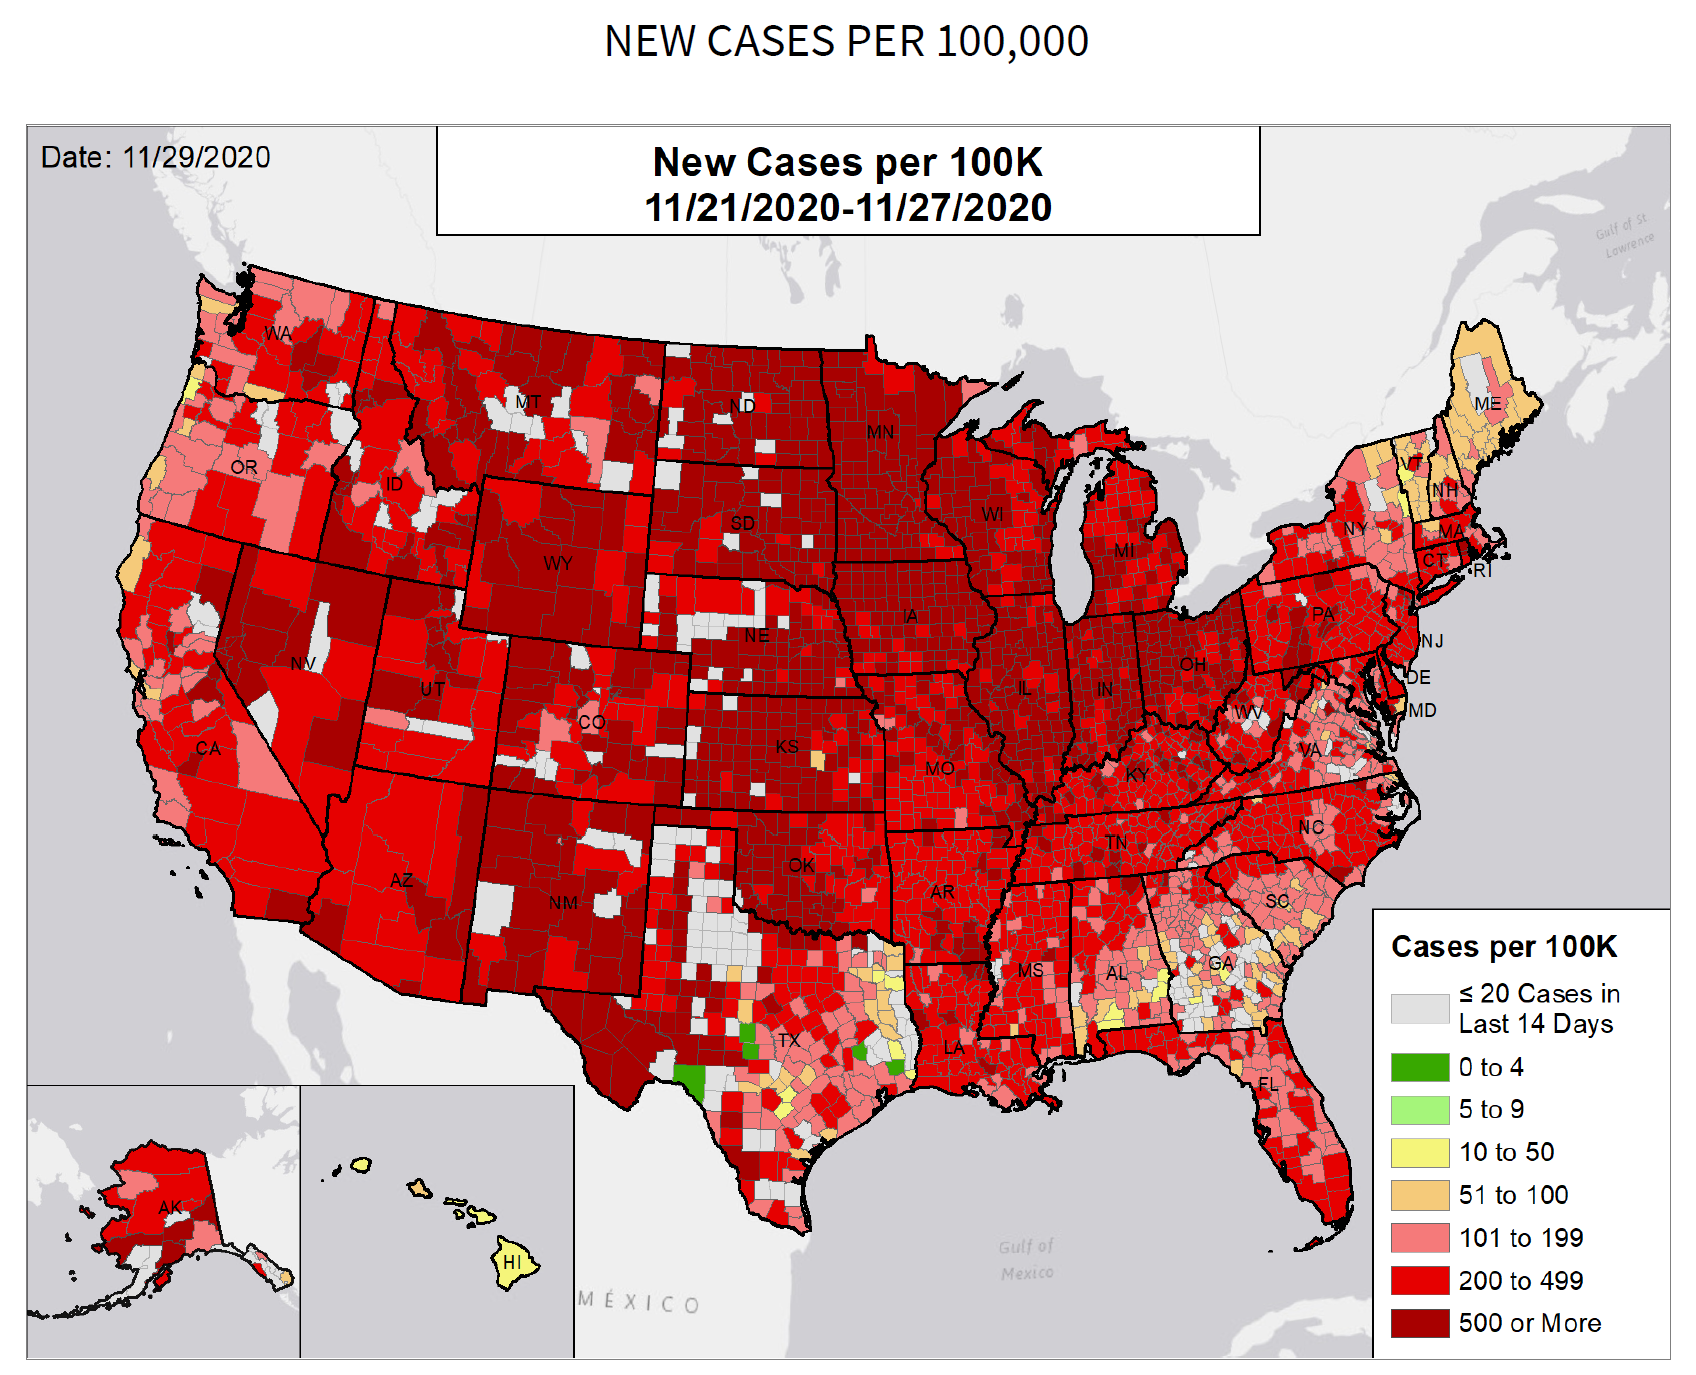
Here’s how counties are classified based on new case rate per 100,000 residents. There are a lot of non-colored counties in the map and this may be a factor of not including antigen cases (antigen tests are being used in rural counties) and less robust test rate per 100,000 in rural counties (I’ll have more on this on Friday). Again, if you’re not looking for disease, you’re less likely to find it.

But based on what we do know from PCR, the northern half of the state is in a more dangerous position than the rest of the state, although, there are localized pockets of intense case rate elsewhere too. As far as our number of counties that fall onto the WHCTF’s list of counties of concern, our number has been steadily increasing since early October and red zone counties are driving this increase.

Finally, here’s a look at the national map for new case rate per 100,000. This is a really bad situation that will likely get worse in the coming weeks with post-Thanksgiving diagnoses.
Today was a *big* day for newly reported cases in the DPH report. There were 4051 cases identified by PCR and 1683 identified by antigen test for a total of 5734. Yesterday was also a big day, and especially for antigen tests, as laboratories began clearing through their holiday/weekend backlog of specimens. Nonrural counties led the way with 33% of the day’s new cases, 26% came from Atlanta suburbs, 21% came from rural counties, and 12.5% came from Atlanta counties of Fulton and DeKalb. You can check your county’s classification here.
Hospitalizations
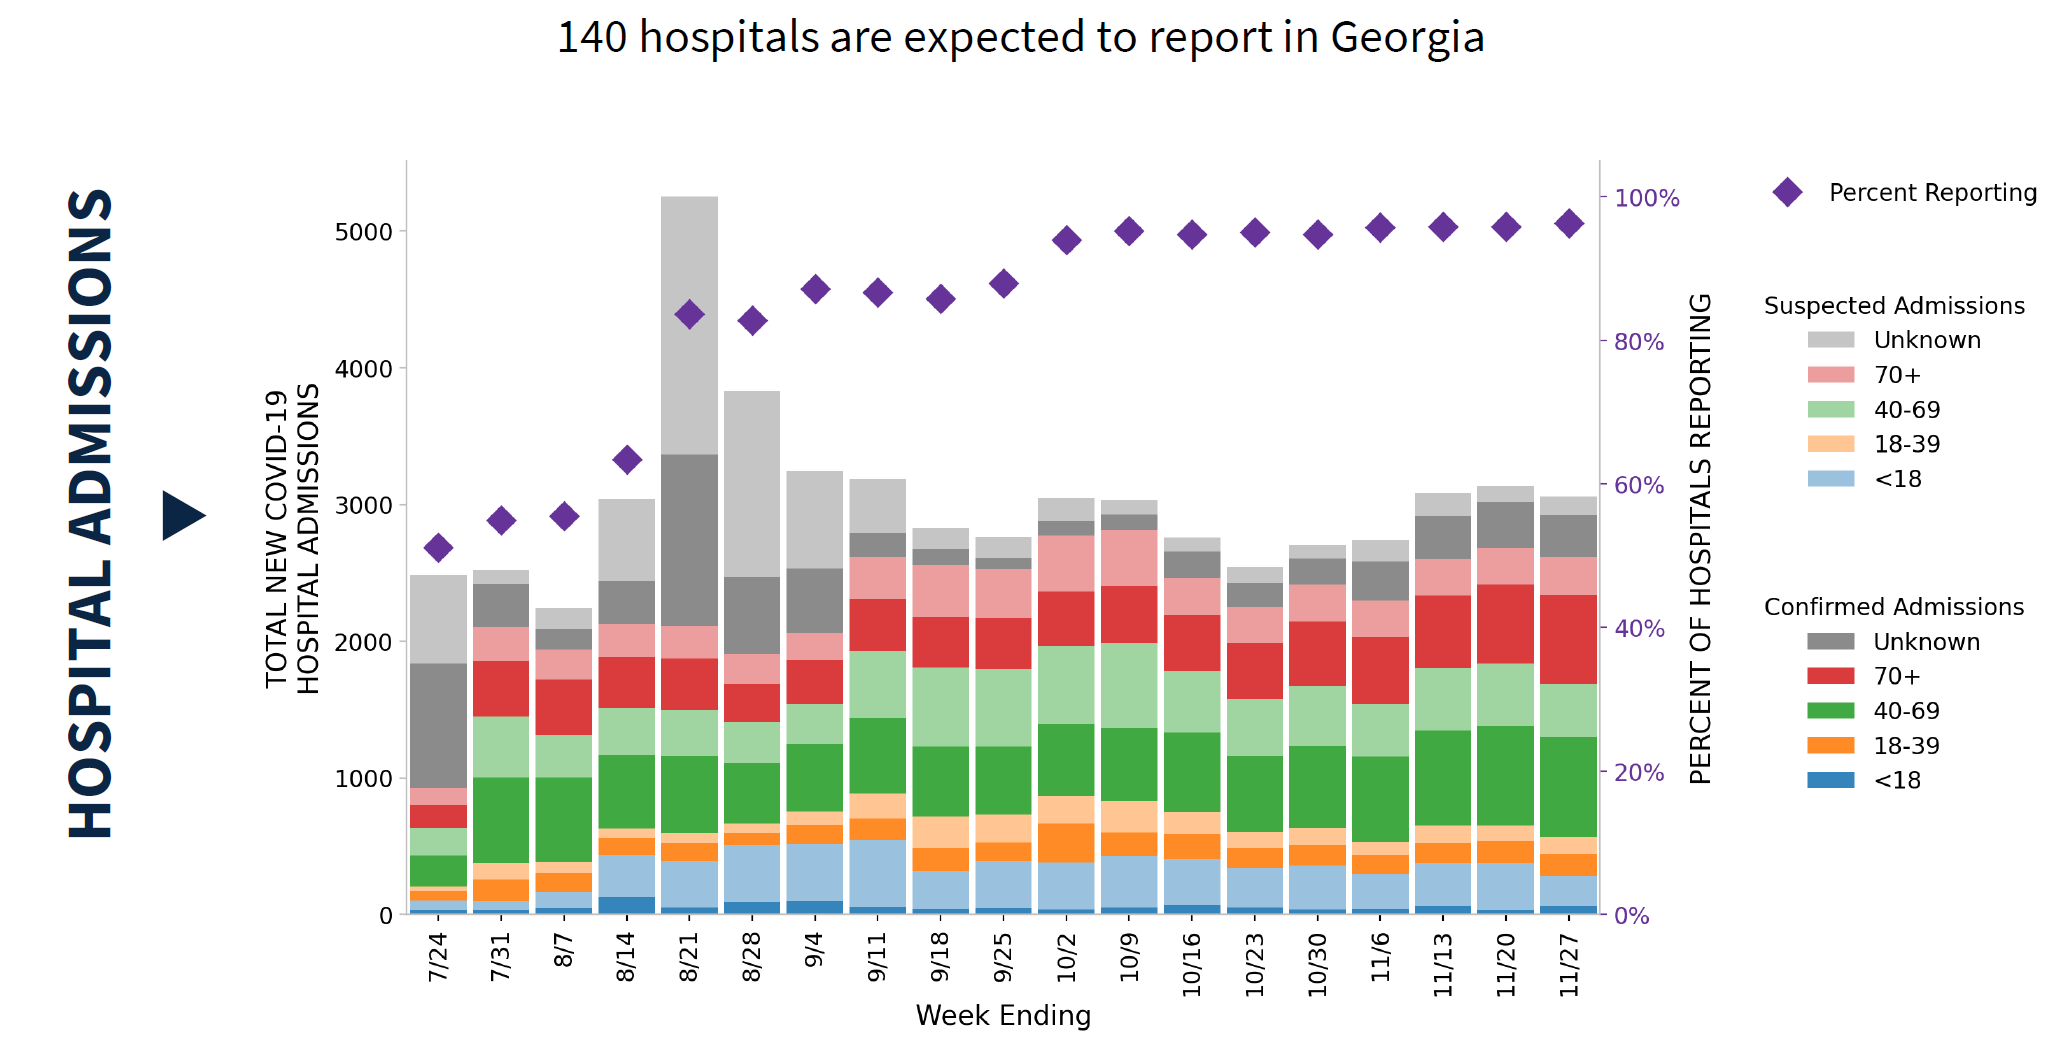
The graph of hospitalized patients for COVID-19 from the WHCTF report is provided below. In the most recent week we saw an increase among pediatric patients but an expansion among those 70+. What’s interesting to me is that this graph indicates that Georgia had ~3000 hospital admissions last week, when the state reported 725 hospitalizations to us during that time. According to the WHCTF, Georgia reported an average number of 340 patients admitted daily with confirmed COVID-19 illness (confirmed by laboratory testing) and 164 admitted daily with suspected COVID-19 illness (lab results pending). There’s a big difference between ~3000 and 725 that can’t be explained solely by the exclusion of suspected case admissions.
The state’s PPE-on-hand situation remains largely unchanged since last week and the WHCTF has taken notice. They’re advising the state to reach out to all hospitals reporting less than a week’s supply of PPE on hand (~10-15% of Georgia hospitals) and figure out the problem.

It’s important to remember that reporting for hospital PPE is most likely whatever the hospital administration chooses to report. Is this PPE inventory based on manufacturer instructions for single use? Or is it based on how hospitals have been able to stretch supplies to last longer, against manufacturer instructions?
In today’s update from the Georgia DPH, there were 263 new hospital admissions and 33 admissions to the ICU. There are currently 2273 patients hospitalized, a small increase compared to yesterday. However, more concerning to me is that 85.3% of Georgia’s ICUs are in use. When Georgia Emergency Management Agency used to provide red-yellow-green color coding for ICU occupancy, this number would put us midway through the yellow zone. The map below shows the ICU bed usage rate for each hospital region. The darker the shade, the greater the usage rate. In fact, for region C (western border with Alabama) their usage rate is 96.2%. The only two regions using less than 80% of their ICU beds are regions K and M, along the southern border with Florida.

So we are already starting to see hospital strain here, before the impact of post-Thanksgiving cases and hospitalizations. I would be very careful about going out into public indoor spaces this week, since those who gathered on Thanksgiving (many of whom are now infected) are infectious to others this week.
Deaths
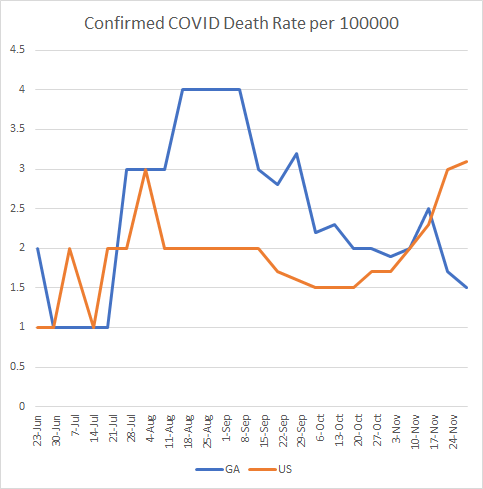
The WHCTF notes Georgia’s death rate is declining, a good thing. As of this week, it’s 63% less than it was at the height of the summer surge, but remains 50% higher than our death rate prior to the summer surge. At present, the Georgia death rate is 52% less than the national rate. We are ranked #44 in the nation, in the orange zone. The Thanksgiving effect may play a role here too. The dates of data collection for this rate calculation were 21-27Nov, so two days’ worth of holiday closures plus the previous weekend might mean that the rates are less than what is probably happening in reality. Generally, nursing homes (where large numbers of the deaths occur) do not report deaths over the weekends and it’s likely they don’t report over holidays either.
While it was a big day for test positivity, cases and ICU bed use, today was a relatively mild day for deaths in Georgia. There was a net increase of 32 deaths, bringing the statewide total to 8830. Twelve of today’s reported deaths came from nonrural counties, 9 came from Atlanta suburbs, 7 came from rural counties and 3 came from the Atlanta counties.
References
https://www.cdc.gov/vaccines/acip/index.html
https://gagio.maps.arcgis.com/apps/opsdashboard/index.html#/47c1cee4d02542bea35bc3324d6cf5e3
https://dph.georgia.gov/covid-19-daily-status-report
https://beta.documentcloud.org/documents/20419012-georgia-11_29_20
https://covid-gagio.hub.arcgis.com/
Georgia COVID-19 Updates is a free newsletter that depends on reader support. If you wish to subscribe please click the link below. There are free and paid options available.
My Ph.D. is in Medical Microbiology and Immunology. I've worked at places like Creighton University, the Centers for Disease Control & Prevention and Mercer University School of Medicine. All thoughts are my professional opinion and should not be considered medical advice.