

The COVID Digest, 18May2021
Georgia COVID-19 Updates

I want to begin with a follow up to the commentary I offered on Sunday with respect to the CDC’s abrupt change in mask guidance. New reporting seems to suggest that political interference did not drive the decision. Instead, it sounds more and more like a combination of poor public health communication that emphasizes individuals over communities and that perhaps the usual CDC clearance process was not followed. Another interesting development is that two long time agency leaders are stepping down within weeks of each other and this mask guidance change. Politico alleges that both are stepping down over reported clashes with the CDC Director. There’s a lot of leaking going on here and communication outside of official channels. That’s not something you typically see in a healthy, well-run agency.
On Sunday, I pointed out that the optics seemed off when the CDC Director was advising people to largely return to normal while her own agency continues to work at 25% capacity. I want to clarify that I am not clamoring for the CDC workforce to return to campus, though I can imagine that laboratory research is difficult to pull off remotely. There’s a lot to like about flexible work settings. These are things that disability advocates have been trying to achieve for decades, but there are unmistakable benefits for everyone. I’m a firm believer that we should not ignore the creativity and lessons learned during this pandemic. That includes the recognition that people do not have to be physically together in order to collaborate productively. Furthermore, the Director doesn’t have direct control over how much of her workforce is physically on campus. It is decided by the Office of Management and Budget. I think my larger point was that while her workforce has the flexibility to work from home, essential workers who will bear the brunt of the risk associated with the updated mask guidance do not have that privilege.
While the abrupt change in guidance has caused many headaches and I may have many, many frustrations over it, it’s just another challenge to public health with which we must contend. It’s disappointing that the challenge was presented by the world’s leading public health agency, but we can’t undo what has been done here. We can only hope that we are vaccinating enough people to ward off the potential fallout. And then hope that social behaviors, racial inequities in vaccine access, and the realities of disinformation and denialism are factored into future guidance changes.
Vaccine Update
The data provided in the table below are publicly available from the CDC update as of the morning of 17May2021. The table compares Georgia’s data to the US average. CDC indicates that Georgia has an inventory of 3,102,915 doses on hand. This week, the state has the 3rd largest stockpile of unused vaccines, 38% higher than the national average when adjusted for population. This week Georgia improved in the rankings for first doses among total population and total eligible population (ages 12+). The state also moved up for vaccine series completion among total population. Vaccinations do appear to be slowing down for Georgians who are 65+. Only two out of three Georgians in this age group are fully vaccinated.
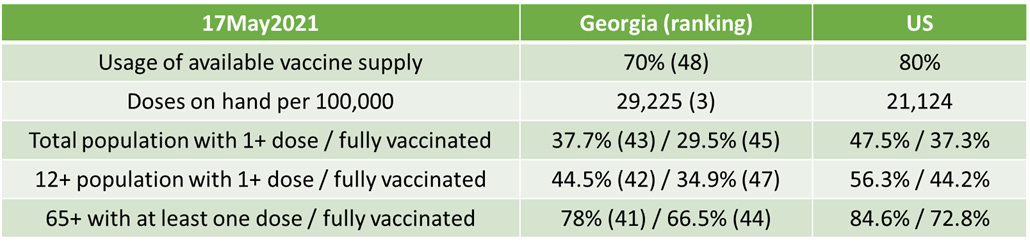
NPR estimates that Georgia will have 70% of its population fully vaccinated by October 30th. For Mississippi, it’s not until August of NEXT year. You can explore the projections for your state of interest here.

Seventy percent is the low end estimate for herd immunity. But vaccinations are only part of the path to herd immunity, and undoubtedly the safer option. Dr. Joshua Weitz’s team at Georgia Tech has estimated where the US and states land based on how many people have been infected and how many have been vaccinated. We should appreciate that there is likely some flux here - a lot of the people who were previously infected were also vaccinated. And a small number of the people who were vaccinated may not be immune if they have an immunodeficiency. But if we choose fully vaccinated for vaccination type and choose the mid-range ascertainment bias (tries to estimate total infections knowing many are asymptomatic), then they estimate that Georgia has a population where 55% have some form of immunity to COVID-19. It’s not far behind the US estimate of 58%. I bring this up because it’s easy to get discouraged when you see how low the Georgia vaccination rates are relative to other states. However, we’re not as far away from the low end of herd immunity as we might think. If we can get 15% more of the Georgia population fully vaccinated, the state may be well on its way to a future where COVID-19 does not affect our daily life. In other words, the finish line may not be as far away as it appears.

In the meantime, the South is in a vulnerable spot. The graphic below from the New York Times characterizes counties by region using the CDC’s Social Vulnerability Index and then compares that to vaccination rates. This index helps governments estimate the counties at greatest risk for natural disasters and infectious disease outbreaks. It’s based on things like poverty, household composition, minority population, housing and transportation. The South is represented in this graphic by the green circles. Circles are sized based on their population. Georgia is not factored into the NYT analysis because the state has a lot of missing data for zip codes among vaccine recipients. More on Georgia’s social vulnerability index scores in a second.

First, I want you to notice that the South is overrepresented in the most vulnerable and moderately vulnerable subcategories - even before any sort of natural disaster strikes. The Midwest (red) and Northeast (orange) are more heavily represented in the least vulnerable subcategories. But we see something interesting here. The communities that are the least vulnerable have the highest vaccination rates whereas the most vulnerable communities have the lowest vaccination rates. It makes sense in many ways, but is nonetheless disappointing. The people with more reliable access to transportation and less poverty are having an easier time accessing vaccines. And that is GREAT for them! But it’s disappointing to see the South lagging behind as it is. This graphic helps us see that barriers to access continue to be a major challenge for vaccination efforts in the South. You can see how Georgia counties are rated by the Social Vulnerability Index in the map below. The closer a county is to 1, the more vulnerable they are. So those in dark blue face the greatest challenges. You’ll notice that the majority of Georgia’s counties are in the dark blue category, especially in the southern half of the state.

The United States
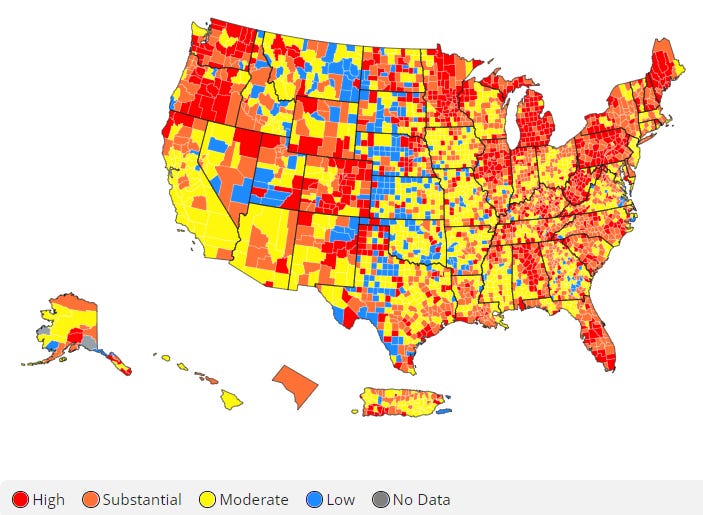
The map above comes from the CDC COVID-19 Tracker on the Community tab, county view. The map above looks at the combined community transmission indicators that looks at both case rate and test positivity. Red and orange are considered the danger zone, yellow is safer and blue is safest. Nationally, things are getting much better in the upper Midwest and Northeast. But things have grown more intense in some parts including Alabama. However, this increase in Alabama appears to be due to a historical data dump, according to the HHS Community Profile Report notes.
The table below tells you where we are this week and how that compares to the previous week (in parentheses). The data for everything comes from the HHS Community Profile Report from 17May2021.

Georgia has just one county in the top 20 counties in the US for new case rate per 100,000 residents - Chattahoochee county at #3 (#4 last week).
The table below shows the highest and lowest ranking states and territories from the latest HHS Community Profile Report (you can find the most recent edition here).

Georgia appears just once on this table, with the 4th worst hospital admission rate in the country.
Georgia
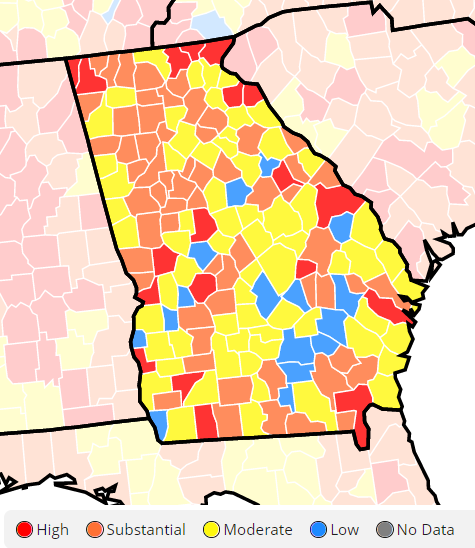
We can zoom in on a current view of Georgia using the CDC community transmission criteria. This week, there are 19 red counties and 60 counties in the orange category. So there are 50% of the state’s counties in the substantial or high transmission categories (last week it was 62%). Nationally, 56% of US counties are in the red or orange zone. So Georgia is performing below the national average, in a good way.
This week, the east side of the Atlanta metro has shifted from orange to yellow. Many of the red counties are clustered along the northern border.
Testing
If we drill down to Georgia in the HHS data, we can see the following test positivity rate by age group in the chart below. There’s improvement for nearly all age groups compared to last week, except 12-17 year olds where test positivity increased. However, only 12-17 year olds are above the 5% goal line. We need to not brush off symptoms in this age group and seek testing. In the meantime, we are undercounting disease among these adolescents.

There were 9125 newly reported PCR tests and 3.4% were positive. However, only 64% of today’s new PCR cases were reported through Electronic Laboratory Reporting. So the 3.4% might not be the best estimate of test positivity today. The positivity rate fits with the trend we’ve seen lately, but we should pay attention when we aren’t seeing all the data. There were 7,985 newly reported antigen tests and 3.7% were positive.
Cases
Today there was a net increase of 767 newly reported cases for Georgia, with 492 identified by PCR and 275 by antigen testing. The state’s case rate is decreasing, and sits at a level we haven’t seen since 12June of last year.
Hospitalizations
Today there were 106 newly reported COVID-19 hospital admissions and 21 admissions to the ICU. There are only 867 patients currently in Georgia hospitals for COVID-19. We haven’t seen a number this low since 15Jun2020.
However, if you look at the HHS data on COVID-19 admissions they show something we aren’t seeing in the DPH data: a big increase in confirmed admissions among 20-29 year olds relative to all other age groups. Let this be a reminder that being young does not make you invincible against COVID-19. Please work to get vaccinated as soon as you are able. Other than 20-29 year olds, our biggest age groups for confirmed hospital admissions are still 50-69 year olds.

Suspected admissions continue to show big numbers for children, but this is most likely an artifact because we don’t test children nearly enough. So when they’re admitted to the hospital, they usually don’t have laboratory confirmation of COVID-19 yet. Hence, they’re listed as “suspected” COVID-19.
Deaths
Today Georgia reported a net increase of 21 newly reported confirmed COVID-19 deaths and 5 probable deaths. This is a low day, thank goodness. The state’s death rate per 100,000 is now 54% below the pre-winter surge baseline, a very good place to be. Let’s keep that going. Get vaccinated or help those around you to get vaccinated.
References
https://covid.cdc.gov/covid-data-tracker/#vaccinations
https://dph.georgia.gov/covid-19-daily-status-report
https://covid-gagio.hub.arcgis.com/
https://covid.cdc.gov/covid-data-tracker/#county-view
https://beta.healthdata.gov/Health/COVID-19-Community-Profile-Report/gqxm-d9w9
https://covid.cdc.gov/covid-data-tracker/#demographics
https://www.politico.com/news/2021/05/17/cdc-covid-masks-walensky-489160
https://www.politico.com/news/2021/05/17/cdc-schuchat-steps-down-489077
https://www.npr.org/sections/health-shots/2021/01/28/960901166/how-is-the-covid-19-vaccination-campaign-going-in-your-state
https://covid19dashboardgt.shinyapps.io/us_immunitylevel/
https://www.atsdr.cdc.gov/placeandhealth/svi/index.html
https://www.nytimes.com/interactive/2020/us/covid-19-vaccine-doses.html
https://beta.healthdata.gov/dataset/COVID-19-Reported-Patient-Impact-and-Hospital-Capa/6xf2-c3ie
Georgia COVID-19 Updates is a free newsletter that depends on reader support. If you wish to subscribe please click the link below. There are free and paid options available.
My Ph.D. is in Medical Microbiology and Immunology. I've worked at places like Creighton University, the Centers for Disease Control & Prevention and Mercer University School of Medicine. All thoughts are my professional opinion and should not be considered medical advice.