

The COVID Digest, 11May2021
Georgia COVID-19 Updates

Vaccine Update
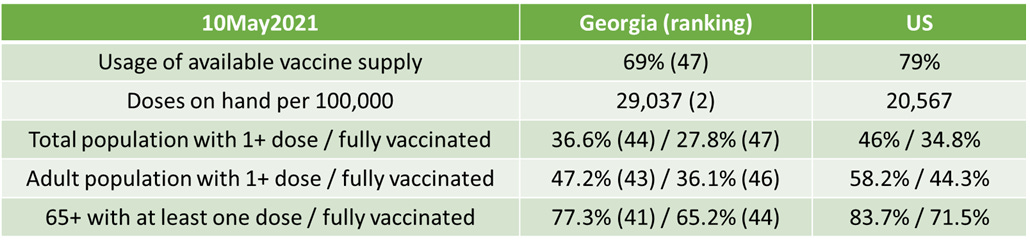
The data provided in the table below are publicly available from the CDC update as of the morning of 03May2021. The table compares Georgia’s data to the US average. CDC indicates that 9.92 million doses have been delivered in the state and 6.84 million have been administered in the state of Georgia. That leaves an inventory of 3,082,988 doses on hand. This week, the state moved up in the rankings for the 2nd largest stockpile of unused vaccines, second only to Alabama. The Georgia stockpile per population is 41% higher than the national average. It was a good week for second doses, with Georgia moving up one position each for the percent of adults and people 65+ who are now fully vaccinated. We also improved for first doses among these populations. It’s hard to know if these improvements are because Georgia is doing better or because other states are doing worse. But if we look at the gap between the state and the nation, this is the part where a sportscaster might say, “they’re running away with it.” Georgia is falling further behind the national average, despite the state’s improvements.
FDA granted Emergency Use Authorization for 12-15 year olds to receive the Pfizer 2-dose COVID-19 vaccine yesterday. This is going to be particularly important for protecting children of color and the poor, who have been disproportionately harmed by the pandemic as I discussed last week.
The Kaiser Family Foundation came out with a super timely analysis of the national and state populations in the 12-15 year group. There are 16.9 million children in this age group, so vaccinating them could make a really big impact not just for their own safety but for our community safety as well. On a national level, almost half of the 12-15 year olds are children of color, with 25.4% Hispanic and 13.4% Black. For Georgia, there are 597,000 children in the 12-15 age group and our population is more diverse than the national average - 44.1% White, 32.5% Black, 14.7% Hispanic, 3.8% Asian and 4.9% Other. Of the children who have died of COVID-19 in Georgia, 60% were Black / African-American.

The other thing to keep in mind is children in poverty. These kids might not have reliable access or transportation to healthcare and might have family members who are essential workers and at heightened risk of infection. More than a third (36.2%) of the nation’s 12-15 year olds live at, just above, or below the poverty line. The percentage tips even higher for Southern states. For Georgia, the number is higher than the national average, at 38.9%, almost 4 out of every 10 Georgia children.

So I think the expansion of vaccine eligibility to 12-15 year olds, if done correctly, can do a lot to address the racial inequity we’ve seen in the pandemic and the additional burdens that have been heaped onto essential workers. It is my hope that we can do more to vaccinate entire families in the coming weeks.
One of my kids will be 12 in a few weeks. And he is getting a COVID-19 vaccine for his birthday among other things (followed by as much ice cream as he wants). I can’t imagine a more important gift that I can give him than saving his life and his future with a safe and effective vaccine. He does not like needles, but he’s excited for this. Both kids wanted to be in the clinical trials. And I would never suggest something for you that I wasn’t willing to give to my own children. I only hope we can see EUA expansion to younger age groups soon. I think many of us will feel far more comfortable with returning to school in the fall if our kids have some protection on board. I’ll be going over the data presented at the ACIP meeting tomorrow on the vaccine for 12-15 year olds on Thursday. If I can answer questions, please don’t hesitate to reach out.
The United States

The map above comes from the CDC COVID-19 Tracker on the Community tab, county view. The map above looks at the combined community transmission indicators that looks at both case rate and test positivity. Red and orange are considered the danger zone, yellow is safer and blue is safest. Nationally, the areas of greatest intensity haven’t really changed in the past week. Although things are getting better for case rates, there are still a lot of counties in the red or orange zones. We have more work to do to bring community transmission down. We can do this by getting vaccinated and following public health recommendations regarding masking and social distancing (known as non-pharmaceutical interventions). When more of the country is vaccinated, we won’t need to rely on the non-pharmaceutical interventions quite so much.
The table below tells you where we are this week and how that compares to the previous week (in parentheses). The data for everything comes from the HHS Community Profile Report from 10May2021.

Georgia has two counties in the top 20 counties in the US for new case rate per 100,000 residents - Chattahoochee county at #4 (#12 last week) and Charlton at #9.
The table below shows the highest and lowest ranking states and territories from the latest HHS Community Profile Report (you can find the most recent edition here). In the past, this table has been built using data from the White House Coronavirus Task Force reports, that evolved into the HHS State Profile Reports. But the timing of those reports, where they collect data through Friday and release the report the following Tuesday or Wednesday, means that by the time we get the reports the rankings within are not very helpful anymore. I’m going to continue to collect data from the State Profile Reports, because the data nerd in me needs a complete record. But I think this shift to more current data makes sense for the newsletter.

I’ve also added some details on how well many states are above 50% of their population with 1+ dose and above 80% for their senior population with 1+ dose of the COVID-19 vaccine.
Certain states are in the top five for multiple non-vaccine metrics, including Vermont and Hawaii. Then there are states like Michigan that are consistently ranked the worst or nearly the worst in the nation. Georgia appears just once on this table, with the 5th worst hospital admission rate in the country. Last week we were the worst, so this is an improvement.
Next, let’s look at how testing is going across age groups on a national level. The top graph shows test positivity, the bottom graph shows tests per 100,000 people. Let’s begin with the top graph (test positivity). There is only one age group for whom test positivity is on the rise, 12 - 17 year olds, and they are above 5%. So we are more likely to be undercounting cases in this age group.

It does appear that states across the country have recognized that test positivity is uncomfortably high for children. Because if you look in the bottom graph, we can see that the testing rate for 12-17 (red line) and 5-11 (light blue line) have been trending up whereas testing for other age groups has held steady or declined. With disease burden coming down among older adults, it’s good to see this shift in focus to monitoring disease in those who do not yet have the opportunity to be vaccinated…although that should change this week when 12-15 year olds are added to the eligibility list. Hopefully we have vaccines available for younger children in the coming months.
The South is in FEMA Region 4. The graph below shows test positivity using the same age group color coding as shown for the graphs above. The test positivity for 12-17 year olds is just below 10%. But this graph shows the gulf that exists between these teenagers and the rest of the population that we test. These graphs can be found in the HHS Community Profile Report executive summary (PDF).

In other words, it’s a good time to have a vaccine available for 12-17 year olds. Hopefully we’ll see test positivity decrease for this age group with improved testing and the case burden among this age group will go down too.
Georgia
We can zoom in on a current view of Georgia using the CDC community transmission criteria. Last week, there were 5 counties in the blue category and 49 counties in the yellow category, with 66% of Georgia’s counties in the substantial or high transmission categories. This week, there are 9 blue counties and 51 counties in the yellow category. So there are 62% of the state’s counties in the substantial or high transmission categories, an improvement. Nationally, 64% of US counties are in the red or orange zone. So Georgia is performing slightly below the national average, in a good way.
This week, more of the Atlanta metro has shifted from red to orange, continuing the trend from the previous week. Things have grown more intense in Southwest Georgia. In fact, we are starting to see a slow but stead rise in their COVID-19 patient census. Hoping this doesn’t grow into something worse.

Testing
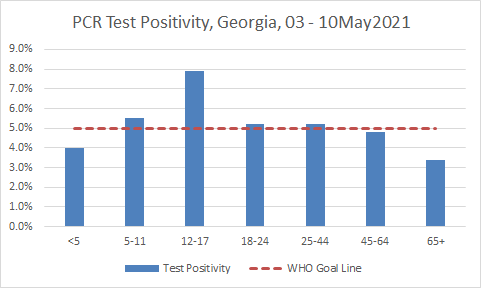
If we drill down to Georgia in the HHS data, we can see the following test positivity rate by age group in the chart below. There’s improvement for nearly all age groups compared to last week. Only children <5 and adults 45+ are under 5% test positivity. We are nearly at 5% for adults ages 18 - 44. But we are undercounting disease in K-12 aged children, 5-17.
It was a robust day for PCR testing volume day for Georgia but not for antigen testing. There were 20,993 newly reported PCR tests and 4.4% were positive. There were 5,696 newly reported antigen tests and 4.4% were positive.
Cases
Today there was a net increase of 958 newly reported cases for Georgia, with 720 identified by PCR and 238 by antigen testing. The state’s case rate is decreasing, and sits at a level we haven’t seen since the summer surge got going in June of last year.
Hospitalizations
Today there were 118 newly reported COVID-19 hospital admissions and 25 admissions to the ICU.
The graph below shows the slow but stead rise in COVID-19 patient census for Southwest Georgia (hospital region K) that I mentioned above.

But some really GREAT news is that according to the Georgia Geospatial Information Office Data Hub, there are fewer than 1000 people in the hospital right now for COVID-19. We haven’t seen a number below 1000 since 21Jun2020. All hospital regions are in the green or yellow zone (n = 4) for COVID-19 patient census. There are only two hospital regions (L and N) in the red zone for ICU bed usage, for all medical needs.
Deaths
Death rate is for both the US and the state. Today Georgia reported a net increase of 20 newly reported confirmed COVID-19 deaths and 3 probable deaths. This is a low day, thank goodness. The state’s death rate per 100,000 is now 40% below the pre-winter surge baseline, a very good place to be. Let’s keep that going. Get vaccinated or help those around you to get vaccinated.
References
https://covid.cdc.gov/covid-data-tracker/#vaccinations
https://dph.georgia.gov/covid-19-daily-status-report
https://covid-gagio.hub.arcgis.com/
https://covid.cdc.gov/covid-data-tracker/#county-view
https://beta.healthdata.gov/Health/COVID-19-Community-Profile-Report/gqxm-d9w9
https://covid.cdc.gov/covid-data-tracker/#demographics
https://www.kff.org/policy-watch/covid-19-vaccines-for-12-15-year-olds-considerations-for-vaccine-roll-out/
Georgia COVID-19 Updates is a free newsletter that depends on reader support. If you wish to subscribe please click the link below. There are free and paid options available.
My Ph.D. is in Medical Microbiology and Immunology. I've worked at places like Creighton University, the Centers for Disease Control & Prevention and Mercer University School of Medicine. All thoughts are my professional opinion and should not be considered medical advice.