
Combined Data
The graph below shows how four of our big metrics for tracking the COVID-19 pandemic are tracking over time. Cases are represented by the blue line and correspond with the left y-axis. All other metrics correspond with the right y-axis. The reason I graph all of these things together is so that we can see the way these things trend together (or differently) over time.

This week we can see that cases, hospitalizations and deaths decreased. ICU admissions rose slightly. However, in the past we have seen how holidays can really impact data reporting. We might want to hold our excitement over big reductions to see whether this coming week has bigger than usual numbers that are delayed reports from the past week.
Testing
The PCR test output trend over time can be seen in the graph below, represented by the blue line that corresponds with the left y-axis. The red line represents the test positivity rate over time, and corresponds with the right y-axis. The gray dashed line is the goal line for test positivity.
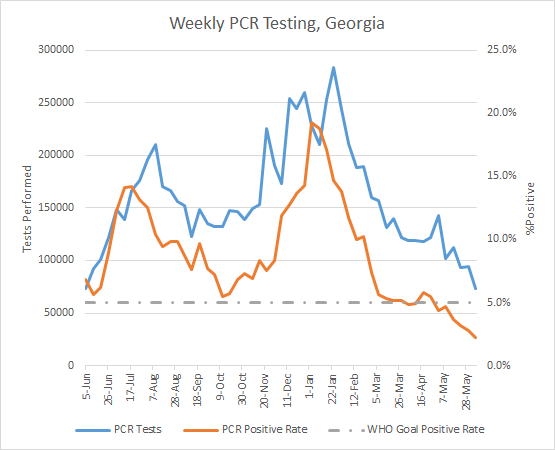
PCR testing output was nearly equivalent to the lowest week since DPH began providing us the data, about a year ago. Meanwhile, the test positivity rate decreased to 2.2%. The state’s PCR positivity rate has been below 5% for the past 6 weeks.
Antigen testing decreased this week, by about 13%, and the positivity rate decreased to 2.6%. Antigen test positivity in Georgia has been below 5% for the past four weeks.

Combined, these data tell us that even though testing is being performed less than it has in the past, we still appear to be testing well enough that we are unlikely to be missing cases.
The DPH does not provide data regarding demographic details for cases identified by the antigen test. Keep that in mind as we go through the demographic data in the following sections. You’re only seeing part of the data. Meanwhile, antigen testing identified 30% of the cases this week.
Cases
The number of combined new cases (by date of report) through Sunday is as follows:
- 24 hours: 199 by PCR + 81 by antigen = 280 (+0.02%)
- 7 days: 1769 by PCR + 761 by antigen = 2530 (+0.2%)
- 4 weeks: 11,289 by PCR + 4,887 by antigen = 16,176 (+1.5%)
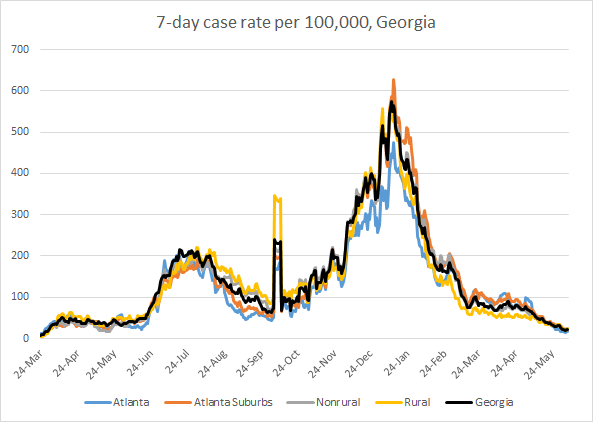
This week cases decreased for all age groups. The 7-day case rate per 100,000 is shown below for the state and for different county types in the state. There is very little variation across county types. But the case rate is lowest in the Atlanta counties of Fulton and DeKalb.
Cases are declining in most age groups, but are relatively flat in those 60-79.

Hospitalizations
The number of new hospital admissions (by date of report) as of Sunday is as follows:
- 24 hours: -6 new COVID-19 admissions (data correction?), 2 admissions to the ICU (weekend reporting is typically light)
- 7 days: 289 new COVID-19 admissions, 123 ICU admissions
- 4 weeks: 1855 new COVID-19 admissions, 450 ICU admissions
When considering the hospital admissions by age, this week shows a pretty steep drop for each age group, reversing multi-week increases for all over the age of 60. I suspect strongly that we are seeing a holiday effect here. So don’t panic if we see big numbers in the coming week.

There is only one hospital region in the yellow zone for COVID-19 patient census, region F in central Georgia. Every other hospital region is in the green zone. For ICU bed usage, there is only one region that is in the red zone, region N (Northwest Atlanta suburbs). However, it does not appear that COVID-19 is the reason for the ICU burden in region N.
Deaths
The number of new confirmed deaths (by date of report) is as follows. The percentage in parentheses indicates how the increase compares to Georgia’s cumulative total at the start of each window of time.
- 24 hours: 1 confirmed, -1 probable deaths (data correction, most likely)
- 7 days: 121 (+0.7%), 28 probable deaths
- 4 weeks: 488 (+2.8%), 131 probable deaths
This week, deaths increased for those 18-49 but decreased for others. Again, I suspect there may be some Memorial Day holiday impact here, so we’ll need to see what happens in the coming week.

That’s it for this week. Be safe and be well!
References
https://dph.georgia.gov/covid-19-daily-status-report
https://covid-gagio.hub.arcgis.com/
https://beta.healthdata.gov/dataset/COVID-19-Reported-Patient-Impact-and-Hospital-Capa/6xf2-c3ie
https://www.nytimes.com/interactive/2021/05/29/us/covid-vaccine-teens.html?smid=tw-share
https://covid.cdc.gov/covid-data-tracker/#vaccination-demographics-trends
Georgia COVID-19 Updates is a free newsletter that depends on reader support. If you wish to subscribe please click the link below. There are free and paid options available.
My Ph.D. is in Medical Microbiology and Immunology. I've worked at places like Creighton University, the Centers for Disease Control & Prevention and Mercer University School of Medicine. All thoughts are my professional opinion and should not be considered medical advice.
Amber, the confirmed death number on Saturday startled me. I haven't been tracking closely lately but it seemed high-over 40-and that wasn't adding in probable deaths. I'm nearly certain we haven't had a number like that in a while. Any thoughts?