The Week in Review, 26Oct - 01Nov
Georgia COVID-19 Updates

Combined Data
Let’s begin with how things are trending for three of our key indicators. The blue line represents cases and corresponds to the left y-axis. The gray line represents hospitalizations and the red line represents deaths and these lines correspond to the right y-axis. I graph these together because it can be helpful to see how the three are linked to each other over time. For example, with the summer surge cases spiked first followed by hospitalizations. But there was a 3 week delay before deaths began to track upward.

What we see this week is that cases continue the increase that began four weeks ago. Meanwhile hospitalizations decreased this week and deaths held steady.
Testing
This week’s testing output was 5.1% less than the previous week. Meanwhile, the percent positive rate has increased over the past four weeks, This sort of negates the disinformation effort that we are seeing more cases because we are doing more testing. We did less testing this week, yet more of the tests were positive. Keep in mind, these data are based only on PCR tests. It does not factor in antigen testing.

In total, there were 139,079 new test results reported this week through Electronic Laboratory Reporting. Of those, 7.3% were positive.
Cases
The number of new cases (by date of report) is as follows:
- 24 hours: 1192 (+0.3%)
- 7 days: 11,059 (+3.2%)
- 4 weeks: 39,057 (+12.1%)
The new statewide total is 361,982 and this week’s case total is 6.7% greater than last week’s. Bear in mind that these case totals are likely an under count of our actual case count - it’s a problem that plagues public health for multiple diseases and especially so when a disease has so many asymptomatic cases, as COVID-19 does. And these cases are those confirmed by the diagnostic PCR test. It does not include those who screen positive through other testing methods such as the rapid antigen test.
The graph below shows how each week’s cases have been distributed by age. Each bar represents a separate week. This kind of graph lets us look at timelines for each age group at the same time.

This week, we saw increases in cases for every age group except those aged 60+. In the past, though, the increases we see in younger population eventually make their way to the older populations with disastrous consequences. If we look at a similar graph below that shows the timeline for different races, we can see that increases were noted for the White and “Other” category (which includes the majority of those who identify as Hispanic/Latinx). There was a large reduction in the “unknown” category, which shows us that contact tracers are not (yet) overwhelmed by the influx of cases and are able to work through some of the backlog.

The case rates per 100,000 people are increasing across all county types. The statewide average (black line) is trending up sharply.

Hospitalizations
There were 652 Georgians newly admitted to the hospital for COVID-19 this week and 136 were admitted to the ICU. The number of patients currently hospitalized as been trending up but hasn’t risen sharply yet like we saw during the summer surge. Hopefully that history doesn’t repeat here.

If we look at how hospitalizations have varied over time with age, we can see that this most recent week featured both increases and decreases in hospitalizations for many age groups. Hospital admissions increased for age groups 1-4, 10-17, 50-69, and 80+.

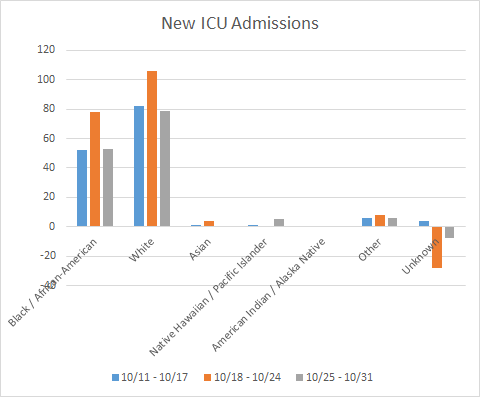
About a month ago, the Department of Public Health expanded the data offerings that could be downloaded each day. Among those expanded offerings are data on hospitalizations and ICU admissions by race and ethnicity. New hospital admissions and ICU admissions for the most recent three weeks are shown below.

It’s hard to see for the races with relatively few counts on these graphs, but new admissions are up for Native Hawaiian / Pacific Islanders and “Other” race category. ICU admissions (below) show decreases for many races (a good thing), but we do note an increase, again, for the Native Hawaiian / Pacific Islander race category.
For our healthcare workers, there were 674 newly reported cases, 30 hospital admissions and 3 newly reported deaths this week. A reminder, our healthcare workforce is not an unlimited or renewable resource. Please limit your exposures to honor the risk that our healthcare workers are taking to care for the ill right now.
Deaths
The number of new deaths (by date of report) is as follows:
- 24 hours: 2 (+0.03%)
- 7 days: 172 (+2.2%)
- 4 weeks: 819 (+11.4%)
This week the number of deaths was nearly equivalent to the week before (171 deaths). The current statewide total is 7981 and of those, 10.3% were reported in the last 4 weeks alone. The case fatality rate is 2.20%. The case fatality rate has been falling for the past two weeks with the increase in cases to dilute the deaths.
As for cases and hospitalizations, here is a graph of deaths by age over time. As you get to the next age group, the timeline starts over.

This week we only saw an increase in deaths for those aged 18 - 39. Deaths are a lagging indicator compared to cases, usually by about 2-3 weeks. So as we see cases increase across the state, we might expect the deaths increase this coming week or next. Hopefully they don’t. But that’s what’s happened in the past. Next, let’s look at how the most recent week’s deaths were distributed by race.

The only race category that saw an increase in deaths this week was the “Other” category. Below you will find the updated 7-day death rate per 100,000 graph, showing how deaths have varied across county types. As noted elsewhere, death rates are steady this week compared to last week. But rural death rates remain 66% higher than the state average.

References
https://dph.georgia.gov/covid-19-daily-status-report
https://covid-gagio.hub.arcgis.com/
Georgia COVID-19 Updates is a free newsletter that depends on reader support. If you wish to subscribe please click the link below. There are free and paid options available.
My Ph.D. is in Medical Microbiology and Immunology. I've worked at places like Creighton University, the Centers for Disease Control & Prevention and Mercer University School of Medicine. All thoughts are my professional opinion and should not be considered medical advice.