The Week in Review, 07-13Dec2020
Georgia COVID-19 Updates

Vaccine update
Yesterday the Advisory Committee on Immunization Practices (ACIP) met to discuss the Pfizer-BioNTech vaccine for COVID-19 that was granted an emergency use authorization (EUA) from the FDA on Friday. You can review some of their slides here. There are lots of interesting details that go with this vaccine, but I will highlight a couple of them here.
The vaccine is meant to be two doses, spaced three weeks apart and you DO need both doses. It is important that an individual receive two doses from the same manufacturer (i.e. both are the Pfizer vaccine) with no mix and match with other vaccines.
Avoid administering the vaccine within 2 weeks of another vaccine (i.e. influenza vaccine, etc).
People should get the vaccine, even if they’ve had COVID-19 already. It is not necessary to test someone prior to vaccination. However, it is recommended that someone suffering from symptomatic infection wait until after they’ve recovered.
No safety data yet on vaccination in pregnant or lactating women. Women in these situations should discuss the risks / benefits of the vaccination, their disease exposure risks and any underlying conditions with their physician. These women may receive the vaccine if they choose to do so.
A person is considered to be fully vaccinated about 2 weeks after they receive their second dose of the vaccine.
People with a history of severe allergic reaction to any injected drug or medication should not receive the vaccine at this time.
Combined Data
This week we set a new record for the most cases in a single week, 41,433, and this is an increase of 30% over the previous week’s total. Weekly case totals can be viewed over time in the graph below using the blue line (corresponds to the left y-axis). Hospitalizations and deaths (gray and red lines, respectively) correspond to the right y-axis.

Hospitalizations also increased this week, with 1598 Georgians newly admitted to the hospital for COVID-19 disease. Hospitalizations have risen 120% over the past two weeks. Deaths increased this week, by 21% over the previous week’s total, but so far they are not surging upward the way that cases and hospitalizations have. If the trend observed over the summer repeats itself here, we might expect deaths to surge in the next two weeks.
Testing
We also set a record this week for testing, the most PCR tests that Georgia has ever recorded, 253,482. You can see how test output has changed over time in the graph below, by consulting the blue line (corresponds to the left y-axis). The red line shows the percent positivity over time and corresponds to the right y-axis.
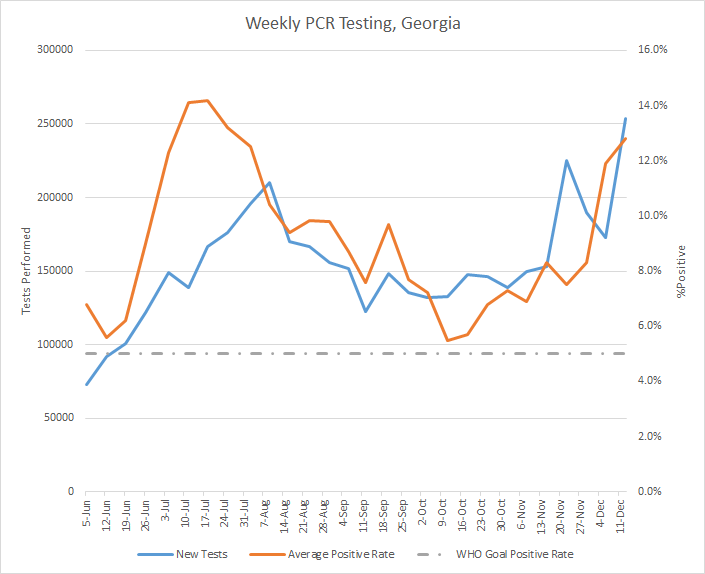
The tests performed this week are an increase of 46.4% compared to the previous week. The weekly percent positive rate has also risen and is now 12.9%. Remember that the percent positive rate tells us whether we are testing widely enough to identify most cases. The higher the number is above 5% the more cases we are missing. So even as we are performing more tests (a good thing!), unfortunately we still are not testing widely enough to identify most cases. The cases we miss contribute to ongoing community transmission of the disease.
What’s interesting this week is we really are not seeing much of a weekend effect for testing (or cases, as a result). The totals yesterday and today are numbers we usually see on weekdays. I don’t know if this is because laboratories are working with more robust staffing over the weekends now that the surge is here, etc. If so, THANK YOU to these laboratorians. It really helps to have these timely data.
Cases
The number of combined new cases (by date of report) is as follows:
- 24 hours: 4310 by PCR + 488 by antigen = 4798 (+0.9%)
- 7 days: 32,222 by PCR + 9,211 by antigen = 41,433 (+8.3%)
- 4 weeks: 89,095 by PCR + 28,754 by antigen = 117,849 (+27.7%)
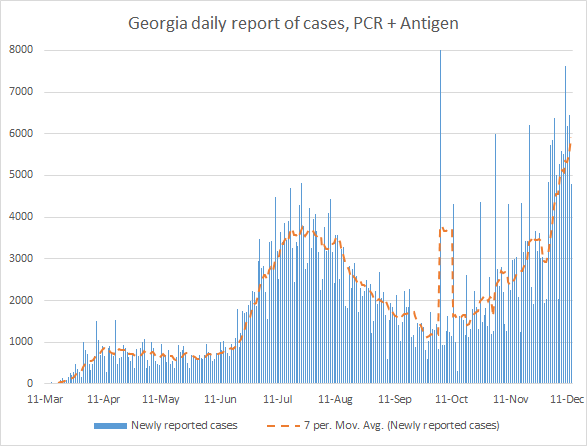
The new statewide total is 542,838, combining PCR and antigen-test identified cases. Bear in mind that these case totals are likely an under count of our actual case count - it’s a problem that plagues public health for multiple diseases and especially so when a disease has so many asymptomatic cases, as COVID-19 does. Of all the cases that have been recorded in Georgia to date, 21.7% were reported in the past 4 weeks. In other words, one in five of the cases we’ve had so far were in the last month, even as we are in the 9th month of this pandemic. In the graph below, I show the Georgia cases by date of report for both PCR and antigen cases, where the red dashed line is the 7-day moving average. Ignore the big bump around 11Oct - that was a data dump of antigen cases. You’ll notice that we are well above the previous summer surge now. In fact, our 7-day rolling average is now 58.1% higher than our previous peak.
The next graph shows us where the week’s new PCR cases are coming from in terms of age groups. The Georgia Department of Public Health does not provide demographic data for any of the antigen cases, in spite of the fact that they investigate those cases the same way that they do PCR cases. Given that antigen cases contributed 22% of the week’s total cases, the graph below only tells us about 78% of the situation. In the graph below you are looking at 8 week timelines for each age group, side by side. The most recent week is shown in maroon.

What we can see from the data we have is that there were increases across all age groups and those increases were most dramatic among those 18-29. Increases were also large for those 10-59. Another issue of concern is the number of cases who fall in to the “unknown” category for age. This is a holding spot for cases while more information is gathered through contact trace investigation and follow up. It might suggest that our contact tracing workforce is getting overwhelmed and backlogged. This observation is even more prominent when you look at the weekly change in cases by race in the graph below. Again, you’re looking at 8 week timelines side by side but for race instead of age this time.
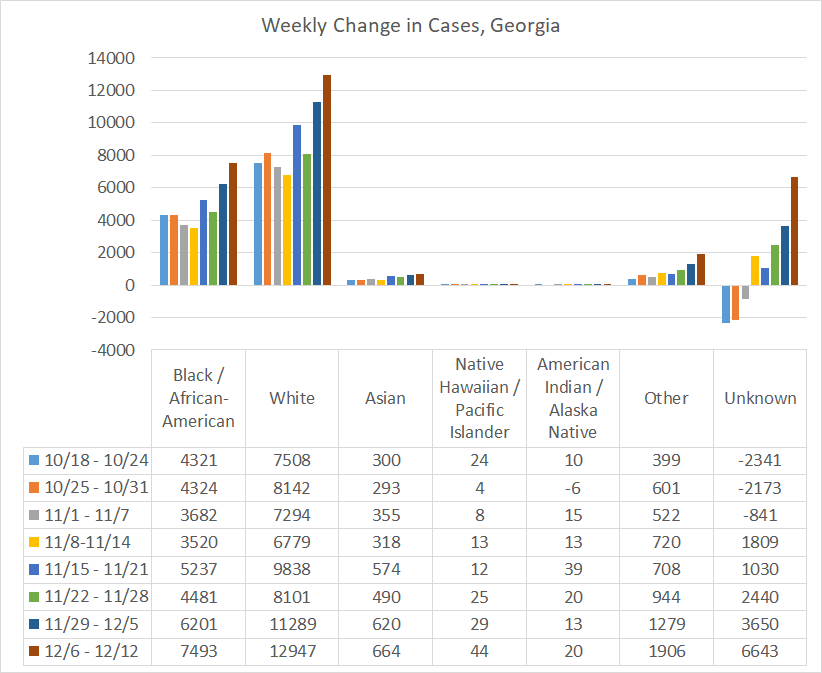
Cases rose for every race this week and nearly doubled for the unknown category. It’s a good reminder that the virus does not care what your age, race, or county type is. It is just looking for the next human to infect. We all need to be cautious.
Hospitalizations
There were 1598 patients newly hospitalized this week and 178 new admissions to the ICU for COVID-19 illness. The proportion of hospitalized patients who ultimately end up in the ICU in Georgia is 18.2% so far, since the start of the pandemic. Of those who have gone to the ICU so far, 38% of them have died. Compare that to the overall fatality rate for Georgia, 1.93%. It’s a stark reminder that while this disease can be minor or even asymptomatic for many, it is far from minor for too many people. A good friend of mine, not that much older than me, was just discharged this week after three weeks in the hospital for COVID-19. She will be on blood thinners and steroids for the next year. Her lungs are completely trashed. She has a long road to recovery ahead of her. And in spite of all of this, she is one of the lucky ones. She got to a hospital in time in a state (Kansas) where there were few beds to be had.
In the graph below, we can see where these new hospital admissions came from, in terms of age groups. The most recent week is shown in maroon. Every age group showed increases except those 5-9.
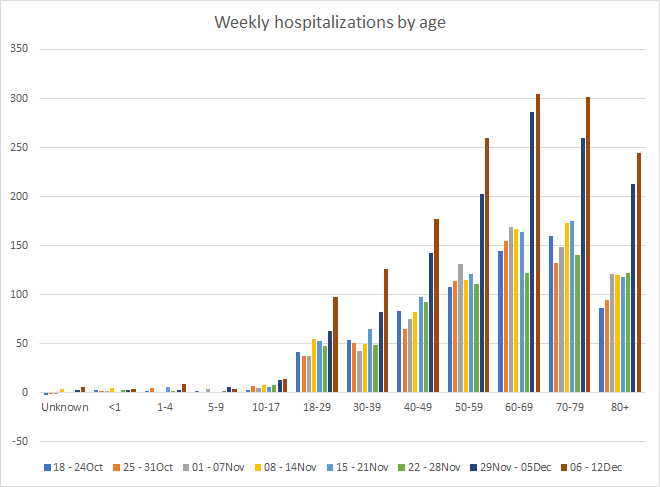
Over the past three weeks, the hospitalization increase has been really large for those 50+. Of all the hospitalizations that have been reported to date, 52.6% were among those 60+ and 45.6% were among those 18 - 59. So don’t fall into the belief that this is a disease that primarily affects the elderly because the data do not support that.
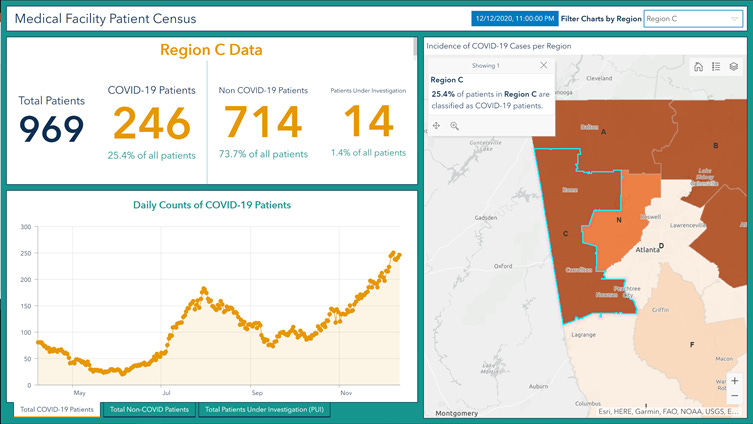
For hospital region C, their currently hospitalized COVID-19 population is 37% higher than it was at the height of their summer surge. One in four of their patients in the hospital are there for COVID-19. For region B, their current number of COVID-19 hospitalized patients is 33% greater than the height of their summer surge. Meanwhile, 30% of the patients in their hospitals are there for COVID-19 illness. Anything above 20% is extreme stress for a hospital. You can look around in the Georgia hospital region data here.
Meanwhile, this is how the number of patients currently hospitalized for COVID-19 is trending for the entire state over time. We are not far from meeting the peak we achieved in late July - early August.

Deaths
The number of new confirmed deaths (by date of report) is as follows. The percentage in parentheses indicates how the increase compares to Georgia’s cumulative total at the start of each window of time.
- 24 hours: 1 (+0.01%)
- 7 days: 234 (+2.6%)
- 4 weeks: 743 (+8.8%)
This week the number of deaths was an increase of 41 compared to the week before (+21%). The current statewide total of confirmed deaths is 9205 and of those, 8.1% were reported in the last 4 weeks alone.
As for cases and hospitalizations, here is a graph of deaths by age over time. As you get to the next age group, the timeline starts over. The most recent week is shown in maroon. A reminder, this graph is built using data for deaths among PCR-identified cases only.

What we see is that deaths rose for many age groups. But the increases aren’t as dramatic as what we see for cases and hospitalizations (thank goodness!). As described in the combined data section this may be the calm before the storm, so to speak. If deaths surge after cases and hospitalizations as they have in the past, then we might need to brace for some grim weeks ahead. Hopefully the trend doesn’t repeat itself.
Periodically, I look at the data we have on the deaths and something I found really interesting is the proportion of deaths for each age group who had an underlying condition at the time of their death. It’s not as high as you might think. We’ve only had 12 deaths to date in the 0-19 category (thank goodness) so there’s a small sample size there, but even among these kids and young adults, only 67% had an underlying condition. Among those age groups with larger sample sizes, the percentage ranges from 57-61%, not that much more than the probability of getting “heads” in a coin toss.

It’s important to remember that an underlying condition doesn’t necessarily make a person more likely to die from COVID-19. And it is incorrect to assume that these people “were going to die anyway,” something I see among those who seek to minimize the seriousness of this disease. For many, their underlying condition is well managed and they likely had a lifetime ahead of them if not for COVID-19. This is just a reminder that we still don’t have enough information to be able to predict who will have more severe forms of this disease. It is therefore important that we all be as cautious as we can.
And as we are now in our 9th month of the pandemic in Georgia, I wanted to look at the impacts of COVID-19 on different county types. The state average death rate per 100,000 residents since the start of the pandemic is 86.7 and that’s nearly equal to the cumulative death rate in nonrural counties outside of the Atlanta metro. The Atlanta suburbs have had the lowest death rate per 100,000, at 60.3 and the death rate for the Atlanta counties of Fulton and DeKalb isn’t that much higher. However, the death rate for rural counties (<50,000 residents) is more than twice as high as the Atlanta metro and 51.2% higher than the state average.

I bring this up so that we can address the problem. Yes, there are significant health disparities between rural and nonrural counties across the nation and healthcare deserts are a part of this. However, more needs to be done to make rural communities aware of the risks and the danger and to fight disinformation in these spaces. The death rate does not have to be this high.
References
https://dph.georgia.gov/covid-19-daily-status-report
https://www.npr.org/sections/health-shots/2020/12/09/944379919/new-data-reveal-which-hospitals-are-dangerously-full-is-yours
https://covid-gagio.hub.arcgis.com/
https://www.cdc.gov/vaccines/acip/meetings/downloads/slides-2020-12/slides-12-12/COVID-03-Mbaeyi.pdf?fbclid=IwAR3gRgnRrdlRPkXCFBRreFzAmp7DP57Dkz1yZHUTBEzPNkVScn7r9CS2GlY
Georgia COVID-19 Updates is a free newsletter that depends on reader support. If you wish to subscribe please click the link below. There are free and paid options available.
My Ph.D. is in Medical Microbiology and Immunology. I've worked at places like Creighton University, the Centers for Disease Control & Prevention and Mercer University School of Medicine. All thoughts are my professional opinion and should not be considered medical advice.