
First, I need to start with an announcement which is that I have transitioned from a faculty member at Mercer University School of Medicine to avid public supporter of its mission and values. My family is relocating to the Kansas City area due to new job opportunities this summer. MUSM has done so much to support my growth and development, including supporting the work that I’ve done to help public understanding of the COVID-19 pandemic and I am so grateful.
I anticipate the COVID-19 updates will continue but there will be some interruptions due to the chaos of moving across the country during a pandemic. Thank you, in advance, for your patience. I’m happy to report that I’m moving to a part of the country that isn’t experiencing this pandemic as intensely as we are here. But they only provide data 3 times a week and I think that will be miserable for me. As a consequence of this move and career changes for me, I also probably need to scale back some of my involvement and may not be as responsive to questions and comments. As much as I love analyzing the data and educating the public, it is mostly an unpaid public service and I need to prioritize traditional employment. And so the updates will become more of a side project rather than what has evolved of the past month into a full time public service.
With that, let’s move on to this week’s review of COVID-19’s progression in the state of Georgia.
Cases
In the first graph below you'll see cumulative cases to date broken down by county type. Previously, I’ve shown this graph since the beginning of the pandemic, but I have since truncated it to when we reopened the state on 24Apr. I've marked the last four weeks with blue arrows.

The number of new cases (by date of report) is as follows:
- 24 hours: 2525 (+2.2%)
- 7 days: 21,410 (+22.4%)
- 4 weeks: 59,245 (+100.2%)
The 7-day and 4-week increases in cases are new records for Georgia. In the past 4 weeks the pandemic has doubled in size, telling you how intense the last month has been. The new statewide total is 116,926. In total, 50.7% of all the cases for Georgia were reported in the past month. In the next graph I've graphed the total number of cases per week. This was the highest weekly increase for cases since the pandemic began and it continues a trend that started three weeks ago.

Here’s a look at the national hot spot map from the New York Times that considers recent 14-day trends of disease. Areas of intense increase are identified in red, areas with declining disease are indicated in blue. You can see that the entire eastern half of the US is experiencing increases in disease, and especially so in the south. However, Mississippi’s disease transmission is decreasing in the past two weeks in many counties.

If we look specifically at Georgia you can see that much of the state is colored in now. Bright red hot spots are found along the Georgia coast, in central Georgia and along the borders.

Hospitalizations
The next graph looks at how current hospitalizations for COVID-19 have changed over time. Today there are 2512 currently in the hospital in relation to COVID-19, an increase of 66 compared to yesterday. As has been the case for the past 12 days, this is a new state record. To head off the question that keeps coming up again and again - yes, these are COVID-19 related hospitalizations according to Georgia Emergency Management Agency (GEMA).

The total hospitalization rate is 11.3% and this number has been decreasing since about three weeks ago. Three weeks ago is when our case counts really began to climb, so I suspect that the reason our cumulative hospitalization rate is declining is because hospitalizations are being diluted by the surge in cases. Something to keep in mind is that hospitalizations and deaths are lagging indicators for disease. People don’t test positive and head straight to the hospital. There can be a significant delay between when a person tests positive and when they might need advanced care. We have already begun to get reports from hospitals in Atlanta that their ICUs are full. With the surges we’ve been seeing in cases and knowing that hospitalizations are delayed, I think our hospitals are going to experience considerable strain in the coming weeks. In the graph above, you see that the increase levels off every so often - those are weekends. This leveling off may be due to delays in reporting that information but in the past weeks we’ve seen hospitalizations increase a lot after each weekend slow down.
ICU beds are one of the most critical resources we need in combating the most severe complications of COVID-19. Another critical resource is ventilators. Below you can see how usage of adult ventilators has trended over recent weeks. The red line is the 7-day moving average to help us see the trend.

From early May to mid June, the usage rate hovered around 30%. But it has been steadily increasing since then and today we set a new record at just under 37% of ventilators in use. That’s the highest it has been since GEMA began providing these details. Not all of these ventilators are being used for COVID-19. At present, GEMA does not provide any details on pediatric ventilator inventory.
Deaths
The number of new deaths (by date of report) is as follows:
- 24 hours: 5
- 7 days: 141 (+4.9%)
- 4 weeks: 550 (+20.3%)
The new statewide total is 3001. So 18.3% of the total deaths to date took place in the past month (a decrease from last week). The statewide case fatality rate is 2.57%, also a decline from last week. This is welcome news for now, but as we see cases and hospitalizations increase, brace for deaths to increase in the coming weeks because deaths are a lagging indicator. Below I’ve graphed how the statewide case fatality rate (left side y-axis) has changed over time compared to cumulative cases (right side y-axis)

What you’ll notice is that the case fatality rate has been dropping like a stone and its precipitous decline began when cases surged. What this tells us is that the reason deaths are declining is because the denominator of that fraction has gotten so large with cases that it is diluting the deaths. And that would be great except we know deaths are a lagging indicator. So I’m not optimistic that this number will continue to decline. We have witnessed strain in our healthcare system this week and if we overwhelm our healthcare system, then triage decisions will have to be made and deaths may rise as a result. We’ve seen this happen in other states like New York City this spring and most recently Arizona. Now Arizona is ordering refrigerated trucks to store their dead. We are not immune to this possibility in Georgia. Hospitals are sounding the alarm - please don’t ignore those warnings. And this is the one thing I keep coming back to when people try to say that this disease is not a big deal. No other infection in our memory has caused hospitals, morgues and funeral homes to run out of space for holding the deceased. Until that is no longer our reality, this virus is very much a serious problem. Please stop trying to argue that the numbers are inflated. We can see the horrifying reality in cities that become overwhelmed. How will our rural hospitals bear this strain?
During the week in review, I do a bit more of a deep dive on the fatality data. Starting with a statewide perspective, here’s where things are among those who have died.
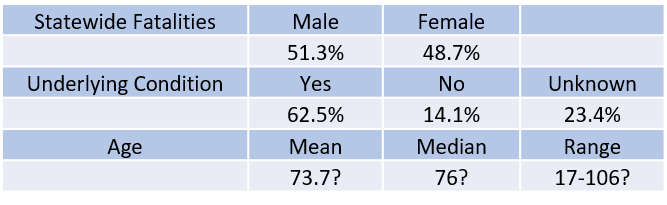
Note: the ? is indicated because Georgia Department of Public Health no longer provides age data for anyone over the age of 90. That makes it difficult to accurately calculate the mean, median, or characterize the range in age. 106 was the oldest individual identified before the DPH change.
However, if we look at fatalities by age group, we see that there’s more to the story. The male:female predominance widens among those 30 - 79. Then it flip-flops and females comprise the majority of cases from 80 years and up. Deaths are most common in those aged 70 - 89. There has been just one pediatric death so far, in a 17-year old.

Next, let’s look at the fatalities by age and race.
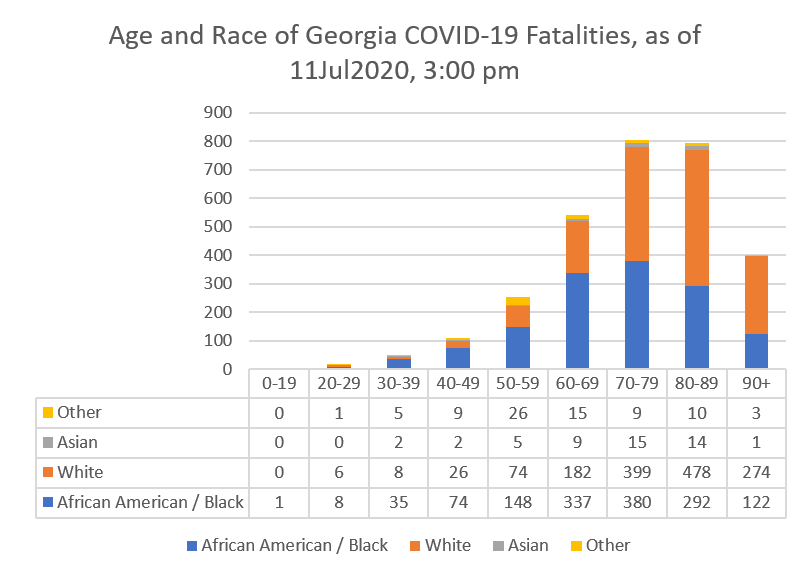
African-American or Black populations are disproportionately impacted by deaths, especially up to age 69. Some of this might be attributed to higher rates of underlying conditions among this population. Asian deaths are most common in those 70-89 years old. The state of Georgia counts Latinx populations in the “other” category. Notably, this population’s deaths are concentrated most among those 50-59.

If we look at how cases and deaths are distributed according to race and compare that to US Census data, then we can gain some perspective on racial disparities. Black or African American individuals are infected at a rate that is just below their composition of the overall Georgia population. However, their rate of death is exceeding their proportion of the Georgia population. On the other hand, White populations are infected at a rate that is about half of their proportion of the Georgia population. their rate of death is similar to Black or African American populations, even though they have twice the population. Notice how large the unknown category is for cases, about 30% of cases haven’t been identified for racial background whereas 0.56% of deaths are of unknown racial background. That’s because it’s a lot easier to access that information through death certificates than through contact tracing. Again, this shows you the enormous task that contact tracers are undertaking.
Combined Data
Lastly, let’s look at how cases, hospitalizations and deaths have shifted among age groups. These data come from the demographics tab on the Georgia Department of Public Health website.

Compared to a week ago, there is a shift in cases from those 60+ to younger populations, a trend we also saw last week. Of all the new cases reported between 04-11Jul, 76.5% were among those between ages 18 - 59, 20.7% were among those 60+, and 9.5% were in children. The unknown category has increased from 0.2% of all cases to 0.7% of all cases this week - a possible sign that contact tracers are falling behind since this category is often a holding spot while they gather more information and then sort cases into the correct age category.
The hospitalization rate has increased for adults 18 - 59, from 14.3% a week ago to 14.7% this week. This population comprised 52.2% of this week’s new hospitalizations. Adults >60 represented 45.1% of new hospitalizations and children represented 2.7% of new hospitalizations. The case fatality rate has decreased slightly for all adults. Adults >60 years old are dying at a rate that is about 20 times that of younger adults.
Media
https://www.wuga.org/post/athens-news-matters-clarifying-state-coronavirus-data-mercer-professor-amber-schmidtke#stream/0
References
https://dph.georgia.gov/covid-19-daily-status-report
https://www.nytimes.com/interactive/2020/us/coronavirus-us-cases.html
Hi Amber! This is really great work; thank you for doing this. A question that's been nagging me for awhile concerns severity of hospitalization. I know GEMA is providing hospitalization data, new hospitalizations & fatalities. Do you think it's possible / useful to extract a rolling average of the duration of stay? I'm very curious to see how our experience treating COVID patients is translating into better results. My hope is that we are getting better at this.
I too have been censored from being able to even share through messenger.