

The Sunday Week in Review, 31Aug - 06Sep
Georgia COVID-19 Updates

Good afternoon! I’m happy to say that I have my workstation set up and feel like the updates are getting back to normal. However, we start virtual school this week at home so bear with me. I’m happy to take any tips for success from my readers who have a month’s head start on me for this.
Testing
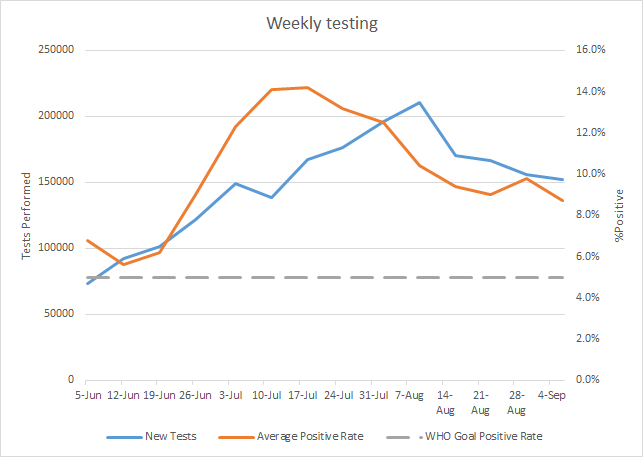
Here’s how testing output looks for the following time periods:
24 hours: 18,839 (a low/mid-range day for Georgia)
7 days: 152,078 (-2.3% compared to last week)
4 weeks: 644,520 (-14% compared to previous 4 weeks)
Below you can see how testing output (blue line) and the percent positive for those tests have varied over time.
An update, I’m almost done compiling the list of Georgia universities and colleges with their links that describe cases and/or testing. So far, it seems like about a third of them report testing data rather than just a running total for cases. Hopefully that comes out tomorrow before school gets busy in my house.
Cases
In the first graph below you'll see cumulative cases to date broken down by county type. Previously, I’ve shown this graph since the beginning of the pandemic, but I have since truncated it to when we reopened the state on 24Apr. I've marked the last four weeks with blue arrows.

You’ll notice the way the slope of our increase has become more shallow over the past few weeks.
The number of new cases (by date of report) is as follows:
- 24 hours: 1615 (+0.6%)
- 7 days: 14,226 (+5.3%)
- 4 weeks: 66,603 (+30.7%)
The new statewide total is 283,199 which means that of all the cases that have been recorded, 23.5% were reported in the past 4 weeks. That is a reduction compared to last week (28.2%). Bear in mind that these case totals are likely an under count of our actual case count - it’s a problem that plagues public health for multiple diseases and especially so when a disease has so many asymptomatic cases, as COVID-19 does. And these cases are those confirmed by the diagnostic PCR test. It does not include those who screen positive through other testing methods.
The graph below shows how the past nine weeks’ cases have been distributed for each age group (total counts, not percentage). So keep in mind that when you get to the next age group, the timeline starts over.
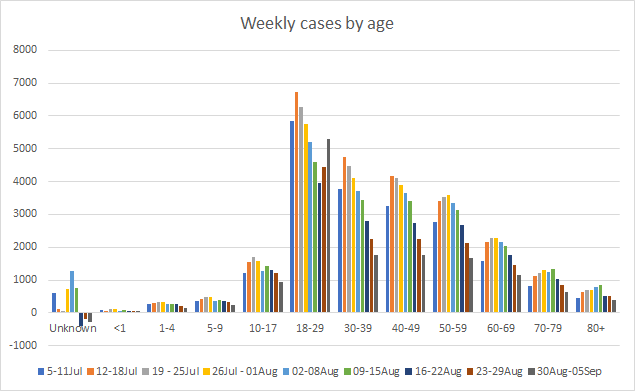
We are starting to see multi-week declines in those aged 30+. Despite the reopening of K-12 schools, we aren’t seeing increases among school-aged children. We are, however, seeing an important increase among 18-29 year old adults. Our summer surge began with a case increase among this age group that then spread to older populations.
The graph below shows how the past five weeks’ cases have been distributed for each race (total counts, not percentage). So keep in mind that when you get to the next race, the timeline starts over.
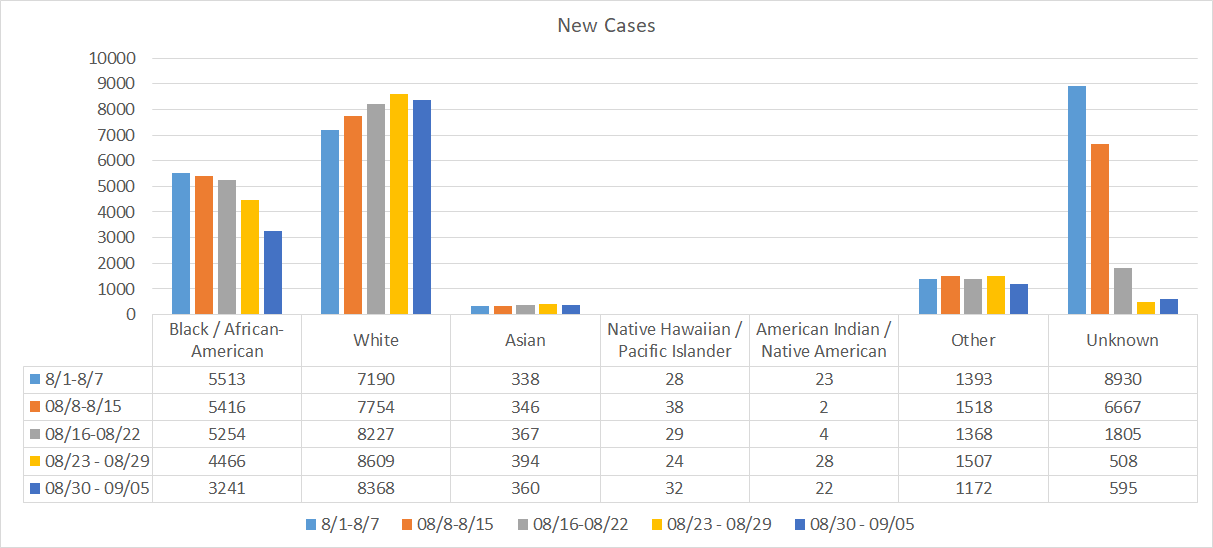
There are declines among Black / African-American populations which is terrific because we know that cases and deaths have disproportionately impacted communities of color. So whatever messaging efforts are happening among local governments, houses of worship and civic organizations is working. Please keep up that important work! We are also seeing declines in the “unknown” population which tells us that the contact tracers have a much more manageable workload now since cases have declined. So big, big kudos to them - again, doing very important work. We are seeing more cases among White populations over time and it remains at a high level.
The graph below shows how the 7-day case rate per 100,000 varies by county type compared to the statewide average.
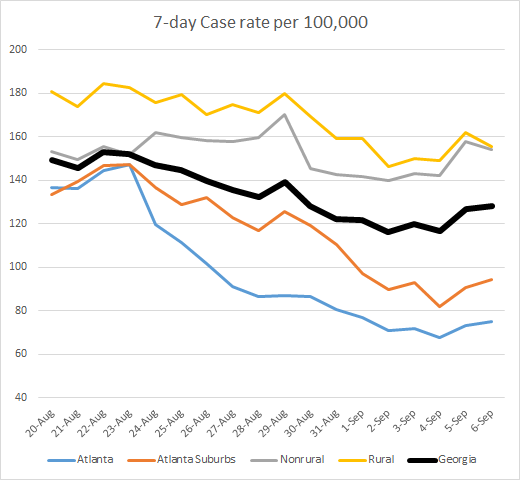
You’ll notice that every county type is seeing an increase in the past two weeks and that is also reflected in the statewide average.
In the past 24 hours there have been 97 new infections reported among healthcare workers. In the past 7 days there have been 795 cases reported among healthcare workers.
Hospitalizations
The graph below shows how the past nine weeks’ hospitalizations have been distributed for each age group (total counts, not percentage). So keep in mind that when you get to the next age group, the timeline starts over. We are starting to see multi-week declines in those aged 40+. Hospital admissions have plateaued for those 18 - 29 and possibly 30-39.

There was a reported spike in hospitalizations yesterday using the Georgia GIO Data hub that has since been corrected. I’m still part of the shuttered Georgia COVID-19 Data Task Force. And when I checked our internal dashboard that shows current hospitalized population at 5:00 pm yesterday, I noted it said 1689. When the Georgia GIO data hub was corrected with the 11:00 pm update, it indicated 1658.
Deaths
The number of new deaths (by date of report) is as follows:
- 24 hours: 60 (+1.0%)
- 7 days: 433 (+7.7%)
- 4 weeks: 1,838 (+43.8%) <- a new record
The new statewide total is 6037 which means that of all the cases that have been recorded, 30.4% were reported in the past 4 weeks, nearly equal to last week. Our deaths are continuing to climb if you look at date of report. When you examine date of death, we are seeing declines. What this means is that there was more death in our peak and the weeks leading up to it than we previously realized. Death reporting can be even more delayed than case reporting.
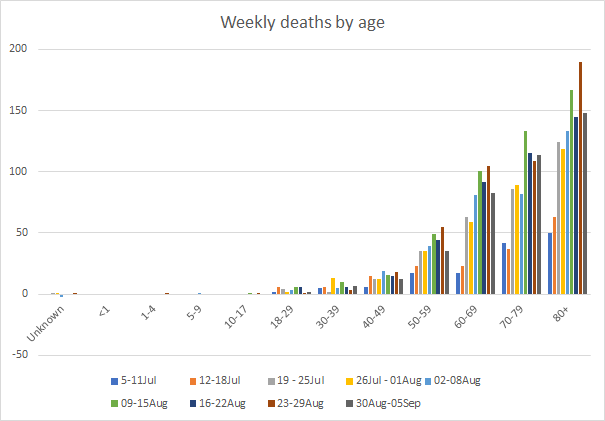
The graph below shows how the past nine weeks’ deaths have been distributed for each age group (total counts, not percentage). So keep in mind that when you get to the next age group, the timeline starts over. We are starting to see multi-week declines in those aged 70-79.
The graph below shows how the past five weeks’ deaths have been distributed for each race (total counts, not percentage). So keep in mind that when you get to the next race, the timeline starts over.

This next table looks at cumulative data (so, from the beginning of the pandemic) for the proportion of deaths in each age group that had an underlying condition. The presence of an underlying condition could contribute to more severe cases of COVID-19, but it does not automatically mean that COVID-19 will be more severe or result in death.

In the past 24 hours there have been 3 newly reported deaths among healthcare workers. In the past week there have been 9 deaths newly reported for the same population.
Combined Data

When we look at weekly totals for cases, hospitalizations and deaths, cases continue to decline but are now slowing that descent. Hospitalizations saw a sharper decrease. Meanwhile, deaths are leveling off. The surge in deaths began three weeks after the surge in cases.
There have been 15,679 cases and 103 deaths among healthcare workers since the start of the pandemic.
References
https://gagio.maps.arcgis.com/apps/opsdashboard/index.html#/e40c39564f724af7bfe8fd5d88deadb6
http://208.97.140.204:8080/epicurveInteractive.html
https://dph.georgia.gov/covid-19-daily-status-report
https://gagio.maps.arcgis.com/apps/opsdashboard/index.html#/e40c39564f724af7bfe8fd5d88deadb6
Georgia COVID-19 Updates is a free newsletter that depends on reader support. If you wish to subscribe please click the link below. There are free and paid options available.
My Ph.D. is in Medical Microbiology and Immunology. I've worked at places like Creighton University, the Centers for Disease Control & Prevention and Mercer University School of Medicine. All thoughts are my professional opinion and should not be considered medical advice.