The Sunday Week in Review, 28Sep-04Oct2020
Georgia COVID-19 Updates
In light of current events, I think it’s important to give a quick refresher on how testing, quarantine and isolation work.
If one has had a high risk exposure (i.e. with a person confirmed to have COVID-19), they are recommended to quarantine for 14 days since that exposure. The reason is because the virus can take up to 14 days to result in symptoms.
If a person has tested positive for COVID-19, then they need to isolate, even from people with whom they live, for at least 10 days after symptoms first appeared AND at least 24 hrs without fever and without fever-reducing medication AND other symptoms are improving. CDC has put together a helpful video on the distinction between isolation and quarantine below.
If a person tested positive for COVID-19 but experienced no symptoms at all, then they need to isolate for 10 days after their most recent positive test.
If a person was at an event where a close contact was positive for COVID-19, it is recommended that the person seek a test 3-7 days after that exposure. That range is there on purpose. In the earliest days, a person might test negative because the virus is low in number and hiding out inside of the person’s cells, replicating and preparing to release thousands of virus particles. If a person tests negative, that just means they were negative on the day when that specimen was collected. They can test positive the very next day in some cases, i.e. what happened with White House communications director, Hope Hicks. What this means is that even if a person was in close contact and tested negative, they STILL need to quarantine for the full 14 days after exposure.
Continuing to hope for a speedy recovery for all who have been sickened with COVID-19. If you would like to follow the contact trace activity at the White House, or what we know of it, anyway, the folks at the Atlantic’s COVID Tracking Project have a handy dashboard.
Let’s move on to Georgia and what happened this week. As you can see below, cases, hospitalizations and deaths have all decreased compared to last week. Note that cases (blue) correspond to the left y-axis whereas hospitalizations and deaths (gray and red lines, respectively) correspond to the right y-axis.

Testing
For testing, both the new test count and the percent positive rate have decreased. In total, 132,249 PCR tests were performed this week, a 2.3% decrease from last week. This week’s percent positive rate is 7.2% compared to 7.7% last week. Note that the testing output (blue line) corresponds to the left y-axis whereas the percent positive and WHO goal correspond to the right y-axis.

Cases
The number of new cases (by date of report) is as follows:
- 24 hours: 847 (+0.3%)
- 7 days: 8,240 (+2.6%)
- 4 weeks: 39,726 (+14.0%)
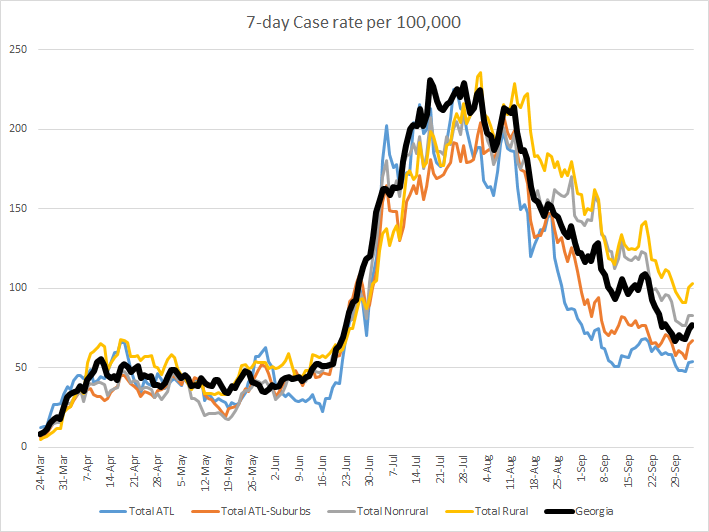
The new statewide total is 322,925 which means that of all the cases that have been recorded, 12.3% were reported in the past 4 weeks. That is a reduction compared to last week (14.5%). Bear in mind that these case totals are likely an under count of our actual case count - it’s a problem that plagues public health for multiple diseases and especially so when a disease has so many asymptomatic cases, as COVID-19 does. And these cases are those confirmed by the diagnostic PCR test. It does not include those who screen positive through other testing methods such as the rapid antigen test. Below you can see how the cases have been distributed across different county types in Georgia, adjusted for population. The solid black line is the statewide average.

Things continue to trend downward, but our statewide rate still remains 96.6% higher than where we were prior to the summer surge. Next, let’s look at how cases have been distributed across age, for the past 8 weeks. These data are based on date of report. There are other graphs much like this to follow. Keep in mind that each bar represents a week’s worth of information and that the timeline starts over when you get to the next age group. It allows us to see the timelines side by side for each age group.

You can see that it’s been a good week, showing declines for all age groups. Similarly, there were decreases across all races this week with the exception of Native Hawaiian / Pacific Islanders. Remember, the unknown category is a holding spot until contact trace investigation can sort cases correctly. Seeing a negative number in this category is a good thing - it means contact tracers are able to clear through some of the backlog.

Hospitalizations
Current hospitalizations are at 1273 today, which is an increase over yesterday, but near equal to our Friday number. There were 34 people newly admitted for COVID-19. We usually see low numbers for this over the weekend. Thirty four is higher than we saw last weekend but is consistent with the weekend prior. Adult ventilators in use has decreased to 28%. Prior to the summer surge, use of adult ventilators consistently hovered around 30%. The only thing showing an increase over time these days is new ICU admissions for COVID-19. Below you can see how the numbers have varied over time. The orange line shows us the trend through the noise of day to day variation.

Next, let’s look at how hospitalizations have been distributed across age for the past 8 weeks. Unlike cases, there are age groups that saw an increase this week, including 5-29 year olds and 50-59 year olds.

Deaths
The number of new deaths (by date of report) is as follows:
- 24 hours: 28 (+0.4%)
- 7 days: 216 (+3.1%)
- 4 weeks: 1125 (+18.6%)
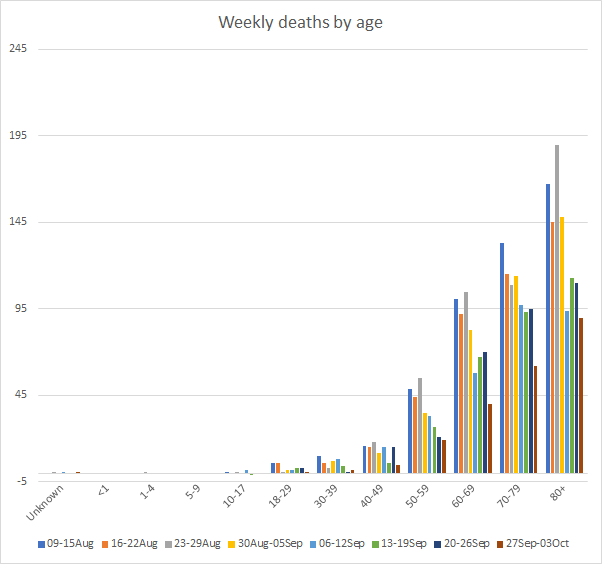
This week we saw a decrease in the weekly total from 344 last week to 216 this week. The current statewide total is 7162 and of those, 15.7% were reported in the last 4 weeks alone. The case fatality rate is 2.22%, the highest it has been since 19Jul. Below you can see how the deaths have been distributed across county type, using a 7-day moving average and adjusted for population. The black line is the statewide average.

You probably noticed that the rural counties have the highest death rate in the state and it is over twice the statewide average. This tells us that rural Georgia is being impacted disproportionately. Next, let’s turn to how deaths have been distributed across age groups for the past 8 weeks.

There was a small increase among 30-39 year olds, but otherwise, the deaths this week were lower than previous weeks for all other age groups. I’m especially happy to see the turnarounds for 60-69 and 80+ year groups and am grateful to see that those recent increases weren’t part of a building trend. Over time, our deaths have trended younger and younger, shifting away from the 80+ category to younger age groups. As a consequence the average age of our fatalities have declined from 74.5 years of age in late May to 73 years of age now.

Next, let’s look at how deaths have been distributed across race for the past 8 weeks. There were decreases for nearly every race category, the exception being those classified as “other” which includes the majority of those identify as Hispanic / Latinx.

To summarize, almost every piece of data I track is trending downward (exception being ICU admissions) and that is certainly welcome news. There is still an open question as to how many cases we will see added when the Georgia Department of Public Health begins providing data on those identified through rapid antigen testing and also how that inclusion will affect testing output and percent positivity. It’s unclear whether this change in reporting is going to happen this week or next, but recent statements from DPH indicated it was coming soon. Enjoy the rest of your weekend! I’ll be back tomorrow to put all of this into the national and global context.
References
https://dph.georgia.gov/covid-19-daily-status-report
https://covid-gagio.hub.arcgis.com/
https://www.cdc.gov/coronavirus/2019-ncov/if-you-are-sick/isolation.html
https://www.cdc.gov/coronavirus/2019-ncov/if-you-are-sick/quarantine.html
https://public.tableau.com/profile/peter.james.walker#!/vizhome/COVID-19attheWhiteHouse-ContactTracking/Home
https://www.fox5atlanta.com/news/health-experts-concerned-results-from-new-covid-19-test-arent-included-in-georgia-case-tally
Georgia COVID-19 Updates is a free newsletter that depends on reader support. If you wish to subscribe please click the link below. There are free and paid options available.
My Ph.D. is in Medical Microbiology and Immunology. I've worked at places like Creighton University, the Centers for Disease Control & Prevention and Mercer University School of Medicine. All thoughts are my professional opinion and should not be considered medical advice.

Thank you, Amber. When individuals get tested in a county in which they do not reside, does the test result get counted for the county in which they were tested or the county in which they reside?