

The Sunday Week in Review, 24-30Aug2020
Georgia COVID-19 Updates

Hello from somewhere outside of St. Louis! If you’ve ever wondered how someone like me would handle a cross country move in the most disease risk-aversive manner, the answer is with a camper. We have our own bathroom, kitchen, beds, etc.
Testing
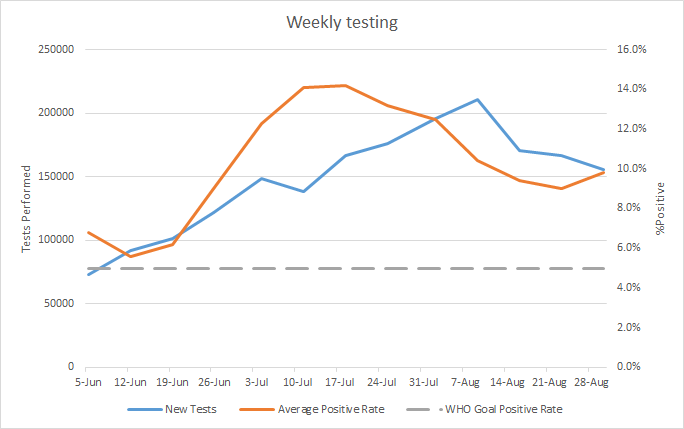
Total tests performed decreased further this week. The percent positive rate rose this week also, from 9 to 9.8%
Cases
In the first graph below you'll see cumulative cases to date broken down by county type. Previously, I’ve shown this graph since the beginning of the pandemic, but I have since truncated it to when we reopened the state on 24Apr. I've marked the last four weeks with blue arrows.

The number of new cases (by date of report) is as follows:
- 24 hours: 1215 (+0.5%)
- 7 days: 15,024 (+5.9%)
- 4 weeks: 75,796 (+39.2%)
The new statewide total is 268,873 which means that of all the cases that have been recorded, 28.2% were reported in the past 4 weeks. That is a reduction compared to last week (33.9%).
From the case bar graph you can see that I often break cases and deaths down by county category. But considering there will be very disparate population densities in those areas, it’s important to see how intense disease is in these counties when adjusted for population. By county type, the 7-day case rate per 100,000 is as follows:

The rate for Georgia as a whole is shown in the bold black line. This makes it easier for us to see that rural and nonrural counties have a higher rate than the state average and the Atlanta metro is below the statewide average. Knowing this might help us know where to target outreach efforts and public health interventions. From the beginning of the pandemic to now, rural counties are being hit harder than any other county type. That’s despite having a lower population density and thus less opportunity for the disease to spread.
Below is a breakdown of how new cases were distributed by age this week (red) compared to last week (blue). There are decreases in every category except those over 80 and those 18-29. The latter is perhaps not unsurprising since colleges are ramping up their surveillance and testing. Young adults, aged 18 - 29 remain our largest age group for new cases. More broadly, the majority of cases are among working age adults.

Something else that’s interesting is how the new cases are distributed by race over the past month.

Cases are increasing among White and Asian populations each week, despite the overall case rate decreasing over that same time. Cases are decreasing each week for the Black / African - American population. Also notice that the number of unknown race cases is decreasing each week which may be a sign that cases are being reported with more complete information or that contact tracers are having an easier time managing their work load as cases have decreased this month.
Hospitalizations
Current hospitalizations are down below 2000, somewhere we haven’t been since early July.

New hospital admissions have leveled off. Together, that probably indicates that people are being admitted, but staying in the hospital for a shorter length of time than before.

Here’s how the new hospital admissions from this week compare to last week, by age. Hospitalizations have decreased for many age groups. But increases are noted for those 18-29 and 40-49.

Deaths
The number of new deaths (by date of report) is as follows:
- 24 hours: 28 (+0.5%)
- 7 days: 472 (+9.2%)
- 4 weeks: 1,764 (+45.9%) <- a new record
The new statewide total is 5,604 which means that of all the cases that have been recorded, 31.5% were reported in the past 4 weeks, nearly equal to last week. Our deaths are continuing to climb as we saw our cases accelerate last month. Deaths are a lagging indicator compared to cases. So we will have a better sense of whether our current “decline” in cases is real depending on what happens with deaths. If the deaths continue to climb, it likely means that cases have also been continuing to climb (to feed that climbing death rate) but we weren’t able to properly see them due to problems with testing output.
Here’s how Georgia fatalities have broken down by age and sex.
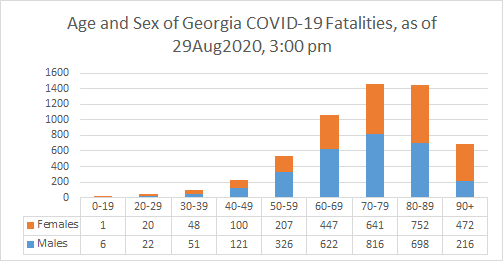
We had two new pediatric deaths this week. All but one of the deaths in those 19 and under have been male and all but one of them had an underlying condition. Males predominate in all age groups up to 79.
And here is how fatalities (cumulative) have been distributed by age and race.

Finally, here is how deaths this week compare to the previous week, broken down by age. There are increases for those aged 40-69 and especially those over the age of 80.

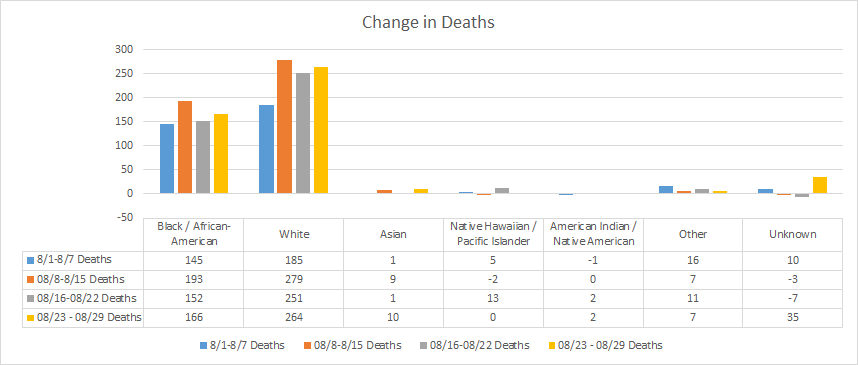
And here is how deaths have been distributed by race week to week this month.
Combined Data

When we look at weekly totals for cases, hospitalizations and deaths, cases continue to decline, but hospitalizations are slowing their descent. Meanwhile, deaths are continuing to increase. The surge in deaths began three weeks after the surge in cases. We might not expect the decline in deaths to start three weeks after the decline in cases begins (in fact, we can see that has NOT happened). Hopefully we will see the decline in deaths, if it is coming, in next week’s numbers.
Lastly, there have been 690 cases and 11 deaths newly reported this week among healthcare workers. There have been 15,679 cases and 103 deaths among healthcare workers since the start of the pandemic.
References
https://dph.georgia.gov/covid-19-daily-status-report
https://gema.georgia.gov/document/document/sitrep-830/download
Georgia COVID-19 Updates is a free newsletter that depends on reader support. If you wish to subscribe please click the link below. There are free and paid options available.
My Ph.D. is in Medical Microbiology and Immunology. I've worked at places like Creighton University, the Centers for Disease Control & Prevention and Mercer University School of Medicine. All thoughts are my professional opinion and should not be considered medical advice.