The Sunday Week in Review
Georgia COVID-19 updates 28Jun - 05Jul2020

I hope everyone had a restful 4th of July. It was a big week for cases so let’s look at how this week compares to where we’ve been.
Cases
In the first graph below you'll see cumulative cases to date broken down by county type. Previously, I’ve shown this graph since the beginning of the pandemic, but I have since truncated it to when we reopened the state on 24Apr. I've marked the last four weeks with blue arrows. The number of new cases (by date of report) is as follows:
- 24 hours: 2,197 (+2.3%)
- 7 days: 18,306 (+23.7%)
- 4 weeks: 43,618 (+81.9%)

The 7-day and 4-week increases are new records for Georgia. The new statewide total is 95,516. To help put that really big number in perspective, Sanford Stadium at University of Georgia can seat 93,246. So 45.7% of all the cases for Georgia were reported in the past month. In the next graph, I've graphed the total number of cases per week. This was the highest weekly increase for cases since the pandemic began and it continues a trend that started two weeks ago.

Here’s a look at the regional hot spot map from the New York Times that considers recent trends of disease. Areas of intense increase are identified in red, areas with declining disease are indicated in blue. You can see that much of Georgia is colored in now. Bright red hot spots are found along the Georgia coast, in central Georgia and along the South Carolina border.

Hospitalizations
Healthcare workers are increasingly sounding the alarm that things are not okay in hospitals across the state and pleading for the public to wear masks and minimize exposures. The next graph looks at how current hospitalizations for COVID-19 have changed over time. Today there are 1805 currently in the hospital, an increase of 79 compared to yesterday.
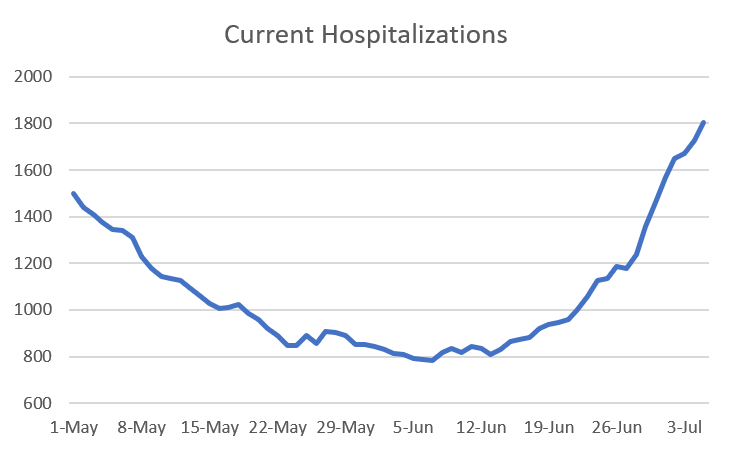
The total hospitalization rate is 12.3% and this number has been decreasing in a big way since about two weeks ago. Two weeks ago is when our case counts really began to climb, so I suspect that the reason our cumulative hospitalization rate is declining is because hospitalizations are being diluted by the surge in cases. Something to keep in mind is that hospitalizations and deaths are lagging indicators for disease. People don’t test positive and head straight to the hospital. There can be a significant delay between when a person tests positive and when they might need advanced care. Hopefully the cumulative number continues to decline, but I suspect we will see increases in hospitalizations relative to cases this week or next.
It’s also important to remember that survival and death aren’t the only outcomes with COVID-19. There are several stories since the beginning of the pandemic of individuals who survive but suffer long-term (possibly permanent) damage to their lungs, strokes, etc. We are fortunate in this country to have robust public health systems, easy access to vaccination, etc. Because of that, we can get complacent into thinking that all infections are benign - you get sick, you get better, you’re good as new. But we have several infections where that isn’t the case, including things like polio, pertussis, etc, and COVID-19 might just be the most modern example.
Our healthcare workers are perhaps better prepared than in April to manage the surge in hospitalizations when it comes due to better experience with the disease and its complications, convalescent serum, remdesivir, etc. But there are limits to their capacity - both in terms of supply and workforce - and we shouldn’t try to test those limits.
Deaths
The number of new deaths (by date of report) is as follows:
- 24 hours: 3
- 7 days: 82
- 4 weeks: 680
The new statewide total is 2860. So 23.8% of the total deaths to date took place in the past month (a decrease from last week). The statewide case fatality rate is 2.99%, also a decline from last week. This is welcome news for now, but as we see cases and hospitalizations increase, brace for deaths to increase in the coming weeks. I desperately hope that I’m wrong.

The case fatality rate has been dropping like a stone since the surge in cases and, again, I think this is a dilution effect from that surge. I’m not optimistic that this number will continue to decline. It is possible that since there has been a shift in cases to younger populations that the death rate will continue to remain low. That’s a reasonable hypothesis and I hope it’s true. But again, if we overwhelm our healthcare system, then triage decisions will have to be made and deaths may rise as a result.
During the week in review, I do a bit more of a deep dive on the fatality data. Starting with a statewide perspective, here’s where things are among those who have died.

Note: the ? is indicated because Georgia Department of Public Health no longer provides age data for anyone over the age of 90. That makes it difficult to accurately calculate the mean, median, or characterize the range in age. 106 was the oldest individual identified before the DPH change.
However, if we look at fatalities by age group, we see that there’s more to the story. The male:female predominance widens among those 30 - 79. Then it flip-flops and females comprise the majority of cases from 80 years and up. Deaths are most common in those aged 70 - 89. There has been just one pediatric death so far, in a 17-year old.

Next, let’s look at the fatalities by age and race. African-American or Black populations are disproportionately impacted by deaths, especially up to age 69.

If we look at age and sex broken down by race, some interesting trends emerge. The average age of death is much younger for Black or African-American and Asian populations, but dramatically younger for the Other category. Another interesting piece of information is that the male:female predominance is huge among Asian and Other populations.

Combined Data
Lastly, let’s look at how cases, hospitalizations and deaths have shifted among age groups. These data come from the demographics tab on the Georgia Department of Public Health website.

Compared to a week ago, there is a shift in cases from those 60+ to younger populations, with children taking the bulk of that shift. In fact, cases increased this week by rates of…
Infants <1 year: 59%
1-4 year olds: 42.6%
5-9 year olds: 36.6%
10-17 year olds: 42.6%
18-29 year olds: 39.8%
30-39 year olds: 27.4%
All older categories increased by 20% or less.
The shift in cases to children and large increases has important implications when considering the reopening of K-12 schools in a few short weeks. The consensus position so far has been that children tend to not have severe symptoms or outcomes. But they absolutely can get infected, as we’re seeing here, and could pass the disease to teachers, bus drivers, cafeteria staff, their peers, and to the families of their classmates. We’ll have to keep following what happens to these kids over the next few weeks and hope that the consensus position matches our observations in Georgia.
The hospitalization rate has decreased for all age groups but, again, this may be a dilution due to the surge in cases - we should know whether this is real in a couple weeks. The case fatality rate has decreased slightly for all adults.
I think we should brace for more record-setting days this week with respect to cases and that trend will continue for at least the next few weeks - fueled in part by 4th of July gatherings and travel. Please continue to reduce your exposures, eliminate unnecessary errands, and wear a mask in public.
Be safe and be well!
References
https://dph.georgia.gov/covid-19-daily-status-report
https://www.facebook.com/GEMA.OHS/photos/a.118773726390/10158140927126391/?type=3&theater
https://www.nytimes.com/interactive/2020/us/coronavirus-us-cases.html
https://www.wabe.org/high-rate-of-hospitalization-from-covid-worries-emory-doctors/?fbclid=IwAR24Y4sDy82FZ6nOso2p51RcW4N0mXPtUNiEMY6kn7_9LIQWoEpgC2D_2JA
https://www.11alive.com/article/news/health/coronavirus/healthcare-workers-send-letter-to-kemp-urging-mask-requirement/85-fa10e913-6a59-4f56-ab87-543e08f05e8a
Thank you so much! This is incredibly thorough and is so helpful.
Thank you