Today we’re going to look at Georgia within the context of national trends for the COVID-19 pandemic.
Cases
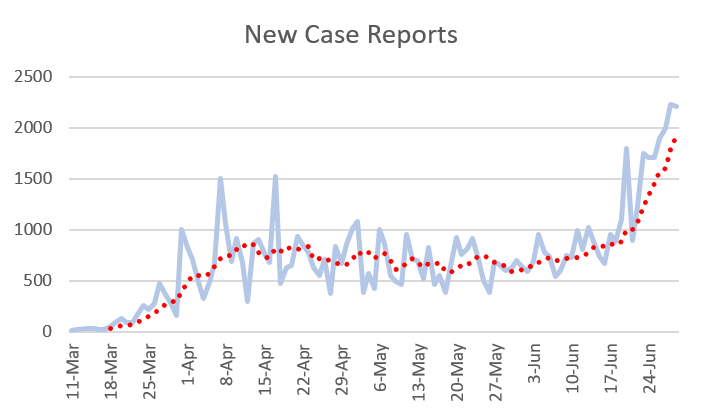
Today there are 2207 new cases reported, just under the record that we set yesterday. Here’s how new case reports have varied over time. To be clear, these are graphed by date of case report - not symptom onset.

It’s noteworthy that today Georgia Department of Public Health had to change the y-axis scale of their incidence curve for cases, because of how large the recent case counts have been (see the 14-day window of uncertainty). Our previous peak that centered around April 21st seems insignificant now by comparison. I’ve marked the 24th of April, the day that reopening began. Note: these cases are graphed by date of symptom onset.

About half of today’s cases are classified in the “unknown” county category. This means that information is pending and these will likely be sorted out in the coming days with follow up and contact tracing. The new statewide total is 79,417.
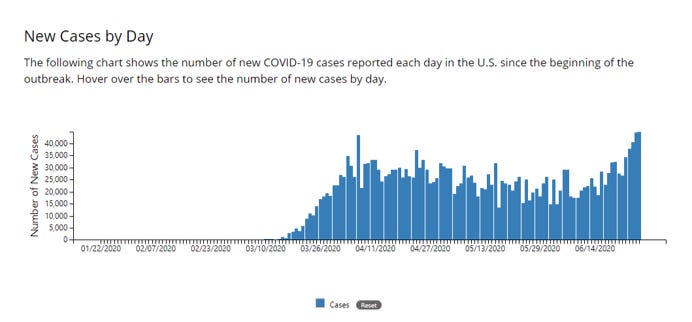
If we look at what is happening nationally, we can see that we are part of a larger trend - cases are going up in a big way and surpassing our previous peak. Of note, the graph below from CDC shows cases by date of report, not date of symptom onset.

Here’s a breakdown of how cases vary by age. This is not dissimilar to what is happening in Georgia - where the majority of cases are in adults under 60.

The CDC came out with an updated version of their COVID Tracker application today and it’s pretty interesting to look around at the different tools they’ve provided. Another big development out of CDC is that they updated their symptom list for COVID-19 which now includes congestion or runny nose, nausea or vomiting and diarrhea. This is not a sign that the disease is getting worse, but rather that with more people sick, it is easier to see what the more common symptoms are.

This next graphic comes from COVID Exit Strategy that monitors states and how their reopening efforts are progressing, analyzing case counts, testing capacity, hospital capacity, etc. Below you see their maps over several weeks time. You can see that the systems they’re monitoring are getting overwhelmed and only a few areas are in a good position for reopening.

Hospitalizations
There was a large uptick in the number of patients currently hospitalized with COVID-19 symptoms. We have almost reached the level on May 1st when Georgia Emergency Management Agency began providing these data. Notably, our rate of increase is steeper than our previous rate of decline.

Below we can see the updated graph from CDC that compares the medical conditions observed in hospitalized pediatric, adult and pregnant patients. The conditions most commonly observed for adult patients are hypertension, obesity and metabolic disease (i.e. diabetes) with cardiovascular disease close behind. For children, most hospitalizations have no known medical condition, but for those that do the most common are obesity, asthma and neurologic disease. Pregnant women comprise just under 25% of hospitalized patients.

Deaths
Today there were 6 deaths reported, a low-end day for us and that is welcome news. The new statewide total is 2784. However, hospitalizations and deaths are lagging indicators compared to cases. So as we see our case counts rise, we should brace for hospitalizations and/or deaths to rise in the coming weeks. Of course, I hope I’m wrong.
After yesterday’s deep dive on some of the demographic details of fatalities in Georgia, let’s look at what is known on a national scale.
The male : female predominance is bigger nationally, at 53.9% : 46.1%.
Whereas cases are most common in younger adults under the age of 65 nationally, deaths are concentrated in older populations. The death rate is 15% for those 50 - 65 and it goes up 5% for each subsequent 9 year age group.
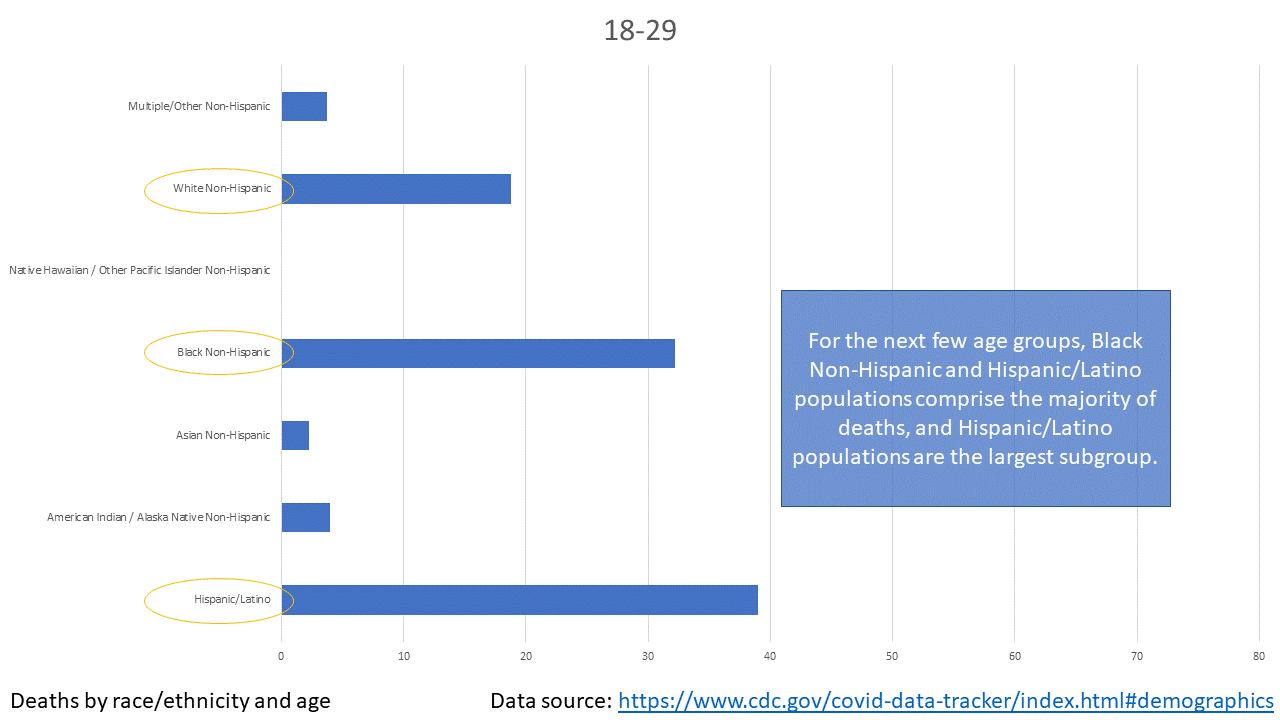
Among all deaths, White/Non-Hispanic populations account for 49.7% of deaths and that is the largest subgroup. However, that doesn’t tell the whole story. Among children and young adults, it is minority populations that are experiencing the greatest death rate.

Then trends are largely the same between ages 18 - 49.

Things shift starting at age 50.

That’s it for today. Be safe and be well!
References
https://dph.georgia.gov/covid-19-daily-status-report
https://gema.georgia.gov/document/document/georgia-covid-19-sitrep-6-29-2020/download
https://www.cdc.gov/covid-data-tracker/index.html#demographics
https://gis.cdc.gov/grasp/COVIDNet/COVID19_5.html
https://www.covidexitstrategy.org/


Hello. The age group should be broken down more than 18-49 (so many in one group!). Also deaths by age broken down by age group as GA health dept does now...as that is very different than the case breakdown by age...
https://dph.georgia.gov/covid-19-daily-status-report