The Daily Digest, 30Oct2020
Georgia COVID-19 Updates

Good afternoon! First, I want to wish everyone a Happy Halloween! I love this holiday and I’m sorry that things are so different this year. I really enjoy seeing the ways that all of you are making it fun for your families though.
I’m adding a new benefit to those who are paid subscribers to the newsletter - I’m going to be offering another opportunity to interact with me and other members of this audience every other month. For the month of November we’re going to do a book club, where I pick a book and then we meet via Zoom to discuss it. If you want to be a part of this, please click the button below. Subscribers at all levels are eligible. I’ll be sending out details to the paid subscribers next week, so subscribe today!
Testing
Today there were 19,663 new PCR test results reported through Electronic Laboratory Reporting and they identified 104% of the net increase in cases reported today compared to yesterday. So there are just a few duplicates that DPH removes in the case totals. Of today’s cases, only 3.5% were backdated prior to the 14-day window. All together, these data points tell us a few things: (1) the cases identified are recent (2) the PCR percent positive rate is a reliable estimate because we had good data reporting today, and (3) our laboratories are not getting backlogged with sample submissions. If you are a laboratorian, thank you for your work!
The 19,663 is a mid-range test output for us, especially over the past few weeks. Today’s percent positive number is 7.3%, which is just above the 5% goal. Anything from 5.1 - 9.9% would put us in the yellow category if we were classifying things as the White House Coronavirus Task Force does. So today’s number is not a bad number, but of course we’d prefer that it be at or below 5%. On Sunday, I’ll be back with a look at how the weekly trend looks, which often gives us a better view of the situation than day to day changes.
Cases
It’s been a bigger week for cases than we’ve seen in recent weeks, and these are only the cases identified through PCR testing. There are additional cases identified through the rapid antigen test but we only get to see those data weekly so far. Today there was a net increase of 1377 newly reported cases compared to yesterday. The updated statewide total is 358,225. Of today’s new cases, 37% came from nonrural counties outside of the Atlanta metro. Another 27% came from the Atlanta suburbs. Rural counties contributed 21% and Atlanta counties contributed 16%.
Here’s how case rate per 100,000 residents has varied over time for different county types. As a state, our 7-day case rate is 3% higher than we were a week ago on Friday.

Next, let’s look at data from the School Aged Surveillance report that DPH publishes on Fridays. First, let’s look at how case rate per 100,000 has moved for different age groups. The graph on the left shows children and college-aged adults. The graph on the right shows the entire population with the blue line representing college aged adults and the yellow line representing all pediatric cases. We can see data like this in the daily status report’s demographics section, but a key distinction is that these graphs show us the cases adjusted for population size.
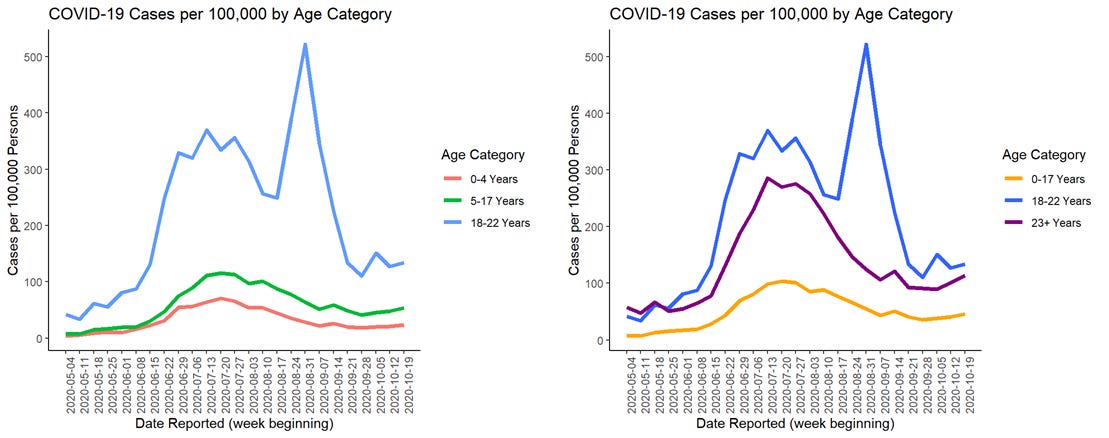
What you’ll notice about these graphs is that case rates are increasing across multiple age groups. If there is an increase for 0-4 year olds, it’s hard to see on this graph, however.
The next graph looks specifically at K-12 aged children and how their cases have trended over time. To be clear, these are all cases across the state that fit into a particular age group. It is not data reported from schools.

The total number of kids infected is going up in recent weeks and for each age group depicted here. I don’t think this is due to outbreaks at schools in particular, but it is consistent with increases we’re seeing among all age groups overall in the state.
The next graph shows us how many clusters of illness that DPH is investigating at school and daycare settings. School is a broad term, encompassing pre-K - college, as well as public and private schools. Here’s how DPH defines their clusters:
Laboratory-confirmed COVID-19 in two or more people (students or staff) with symptom onset/collection dates within a 14 day period who are epidemiologically linked, do not share a household, and were not identified as close contacts of each other in another setting during standard case investigation or contact tracing.
So this means that the school setting is their epidemiologic link - they aren’t family members or in the same karate class outside of school, for example, and that couldn’t have linked their cases together rather than the school environment.

The number of clusters being investigated by DPH is decreased this week compared to the previous two weeks (a good thing). We’ve also seen a decrease in the number of clusters associated with daycare centers this most recent week (also a good thing). Hopefully that trend continues.
Hospitalizations
Today there were 90 COVID-19 patients newly admitted to the hospital and 13 were admitted to the ICU. There are 1373 patients currently hospitalized for COVID-19 today. Twenty nine percent of adult ventilators are in use, consistent with the rate observed prior to the summer surge (so, this is a “normal” number).
Today 83.5% of ICU beds are in use in Georgia and this puts us in the yellow zone according to the stoplight-inspired color coding that Georgia Emergency Management Agency used to use to describe this metric. Not all of these beds are occupied by COVID-19 patients, but it means our hospitals might have a harder time coping with an influx of patients for COVID-19 or unrelated reasons (i.e. car accidents, heart attacks, etc). Looking at just the most recent two months, this number isn’t a record setter, but it is high relative to where we’ve been since mid-September. Looking at the trend line (red dashed line) we are seeing less variation and a steady increase since a few weeks ago.

There are five hospital regions using >90% of their ICU beds today: region E (91.4%), G (92.1%), H (97.4%), L (90.4%), and N (94.4%).

Lastly, let’s look at how emergency room visits for COVID-19 symptoms have varied over time for children and young adults studied in the school aged surveillance report. In the previous week we saw a unanimous increase across all age groups, not unlike we saw at the start of the summer surge. But this week we see that things slowed down for all but one age group (14-17 year olds). That’s certainly better news than we might have expected.

Deaths
There was a net increase of 32 deaths today compared to yesterday, bringing the statewide total to 7955. Fifteen of these deaths came from nonrural counties outside of the Atlanta metro. Nine came from rural counties. The death rate per population is decreasing, especially for rural counties. That is great news since they’ve been the hardest hit. With today’s data, the death rate in rural Georgia counties is now only 57% higher than the state average.

References
https://dph.georgia.gov/covid-19-daily-status-report
https://dph.georgia.gov/school-aged-covid-19-surveillance-data
https://covid-gagio.hub.arcgis.com/
Georgia COVID-19 Updates is a free newsletter that depends on reader support. If you wish to subscribe please click the link below. There are free and paid options available.
My Ph.D. is in Medical Microbiology and Immunology. I've worked at places like Creighton University, the Centers for Disease Control & Prevention and Mercer University School of Medicine. All thoughts are my professional opinion and should not be considered medical advice.