

The Daily Digest, 29Mar2021
Georgia COVID-19 Updates

Vaccine Update

Nationally, 79.4% of the available doses have been administered, either as a first or second dose. This number is exactly the same as last week. Over 143 million doses have been administered in the US. Of the US adult population 36.2% has received at least one dose and 20% have been fully vaccinated. Among those 65+, 72.4% have received at least one dose and 48.4% are fully vaccinated. Across all 50 states, territories and other recipients, there are 37,183,774 doses on hand (11,206 per 100,000 residents).
Georgia’s usage rate is below the national rate, at 68.9%, but the state has moved down slightly in the rankings for this from #45 last week to #47 this week. There have been 5,385,975 doses delivered to the state of Georgia and 3,711,950 have been administered. It means that Georgia has 1,674,025 doses of the vaccine on hand, unused (or 15,767 per 100,000). This surplus is 41% higher than the national average. But considering how many people have had to cross state lines to get vaccinated, it is probably best to look at doses administered per 100k by state of residence. CDC doesn’t provide that number to us, unfortunately. But perhaps the workaround for this is to look at the percent of total Georgia population with at least one dose or fully vaccinated by state of residence. This takes the confusion out of where a person received a vaccine. Almost 22.6% of the state’s total population has received at least one dose of the vaccine (#50 in US, +19% compared to last week) and 11.9% of the state’s total population is fully vaccinated (#49 in US, +8% in the past week).
Let’s compare Georgia’s numbers to the leader, New Mexico. In New Mexico, 37.1% of the state’s total population has received at least one dose and 22.8% of the total population is fully vaccinated.
Georgia Governor Brian Kemp prioritized vaccinations among those 65+ and this is definitely a bright spot in otherwise lackluster data for the state. According to CDC data, 48.7% of that age group is fully vaccinated in Georgia (national average is 48.4%). Georgia is ranked #29 for this metric, down from #18 last week.
The World

According to the New York Times Coronavirus Tracker, the SARS-CoV-2 virus that causes COVID-19 disease has sickened >127.2 million people (+3.8 million since last week) and killed at least 2,783,800 (+65,600 in the past week) worldwide as of this morning. For both cases and deaths, the increases this week are greater than the increases during the previous week. So it seems that things are growing more intense.
The US is ranked #54 in the world for average daily case rate per 100,000 people over the past 7 days (last week #56) with a rate of 19 (last week, 16). The top five countries for average daily case rate per 100,000 in the past week are Curacao, San Marino, Hungary, Estonia and Jordan.
For deaths, the US average daily death rate per 100,000 over the past week is 0.30 (previous week was 0.32), and we are ranked #44 in the world for this (last week we were ranked #40). The top five countries for average daily death rate per 100,000 in the most recent week are Hungary, San Marino, Bosnia and Herzegovina, Czech Republic and Bulgaria.
The United States

The map above comes from the CDC COVID-19 Tracker on the Community tab, county view. The map above looks at the combined community transmission indicators that looks at both case rate and test positivity. Red and orange are considered the danger zone, yellow is safer and blue is safest. This week the entire state of Michigan is red and one county is orange. The northeast and east coast states are filling in with red counties, including South Carolina and Florida.
As of this morning, the New York Times coronavirus tracker indicates there have been over 30.2 million cases (+400,000 in the past week) and 548,867 deaths in the US (+6280 in past week).
According to data from the 28Mar2021 HHS Community Profile Report (the source document for the White House Coronavirus Task Force reports), the top five states in the nation for new case rate per 100,000 residents are New Jersey, Michigan, New York, Rhode Island and Connecticut. The top five states in the nation for new death rate per 100,000 in the past 7 days are Kentucky, Georgia, California, Massachusetts and New York.
The table below tells you where we are this week and how that compares to the previous week (in parentheses). The data for everything comes from the HHS Community Profile Report from 28Mar2021.

This week the rankings for Georgia haven’t moved dramatically. On a national level, case rate has increased 10% this week, a concerning trend. The percentage of patients hospitalized for COVID-19 is about the same as last week for both Georgia and the US. Georgia remains in the top 10 for percent of hospitalized patients who are being treated for COVID-19 and new death rate. Bacon county in the southeast corner of Georgia has the highest new case rate in the country right now.
Last week, I pointed out that national trends for test positivity were starting to tick upward. Meanwhile, test positivity was increasing and sharply so among 12-17 year olds and 25 - 64 year olds. This week (see below), test positivity is increasing for every age group except those 65+.

The last thing I want to show you comes from the executive summary of the Community Profile Report provided in PDF format daily. The map below shows percent change in case rate per 100,000. You want to be in the green or yellow categories. You don’t want to be in the red or pink categories. Notice that things are getting better (greener) for the Carolinas and Alabama. But there is a lot of pink and red in Florida, Tennessee and parts of Georgia. If we expand our view and look more nationally, you can see that things are intensifying for Oklahoma, Minnesota, Illinois and Michigan, Pennsylvania and New York.
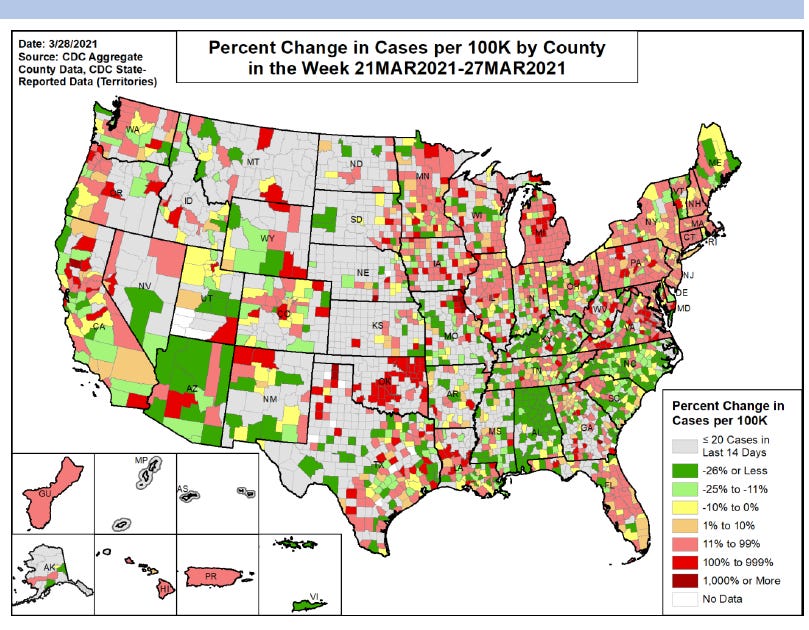
This morning, CDC Director, Dr. Rochelle Walensky warned that we are heading into a fourth surge that shares a lot of similarity with trends recently observed in Europe. Remember, right now the surge appears to be regionally contained to the northeast and upper midwest. But with Spring Break travel and states reopening aggressively while vaccination rates are still relatively low, we should adopt a surge mindset to limit the impacts (if any) on Georgia.

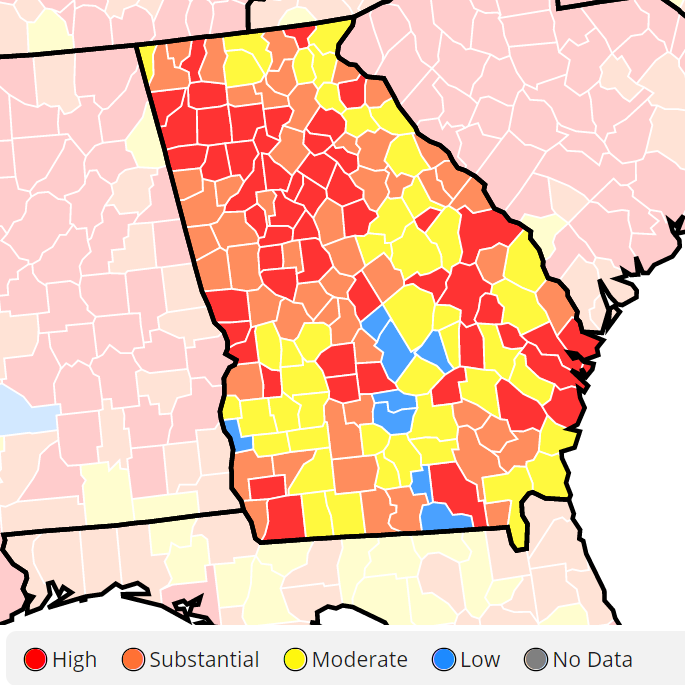
Georgia
We can zoom in on a current view of Georgia using the CDC community transmission criteria. Last week, there were 8 counties in the blue category and 45 counties in the yellow category, with 67% of Georgia’s counties in the substantial or high transmission categories. This week, there are 4 blue counties and 40 counties in the yellow category. That leaves 72% of the state’s counties in the substantial or high transmission categories. So on a county to county level, disease transmission inched up slightly this week.
Let’s discuss today’s numbers for Georgia.
Testing: a low day for both PCR and antigen testing. For PCR testing, there were 12,528 new PCR results reported, 5.5% of which were positive. There were 4128 new antigen tests reported today and 11.9% were positive. The graph below shows how PCR and antigen test positivity have compared during that time. It seems that there is more day to day variation in antigen test percent positivity.


Cases: cases are often lower on Mondays due to weekend effect. But today’s numbers are 57% higher than last Monday. Today there was a net increase of 1165 newly reported cases (806 by PCR, 359 by antigen test). The 7-day case rate remains 22% above the pre-winter surge baseline.
Hospitalizations: Usually we see small numbers for the weekend that show up on Sunday and Monday. There were 35 new hospital admissions for COVID-19 today (last week, 29) and 1 admission to the ICU.
According to the HHS Community Profile Report, the Georgia counties with the highest percentage of COVID-19 patients are Douglas, Paulding, Forsyth, Greene, and Newton counties.
Deaths: there were 36 newly reported confirmed deaths compared to yesterday’s total and 0 probable deaths. Death reporting on Mondays is typically low due to weekend effect. For today’s deaths, 36% came from nonrural counties outside of the Atlanta metro and 22% came from rural counties. The state 7-day death rate per 100,000 residents is 107% above the pre-winter surge baseline.


References
https://covid.cdc.gov/covid-data-tracker/#vaccinations
https://beta.healthdata.gov/download/gqxm-d9w9/application%2Fpdf
https://dph.georgia.gov/covid-19-daily-status-report
https://covid-gagio.hub.arcgis.com/
https://www.nytimes.com/interactive/2020/us/coronavirus-us-cases.html
https://covid.cdc.gov/covid-data-tracker/#county-view
https://dph.georgia.gov/school-aged-covid-19-surveillance-data
https://www.npr.org/sections/coronavirus-live-updates/2021/03/29/982302294/cdc-director-fears-impending-doom-if-u-s-opens-too-quickly
Georgia COVID-19 Updates is a free newsletter that depends on reader support. If you wish to subscribe please click the link below. There are free and paid options available.
My Ph.D. is in Medical Microbiology and Immunology. I've worked at places like Creighton University, the Centers for Disease Control & Prevention and Mercer University School of Medicine. All thoughts are my professional opinion and should not be considered medical advice.