

The Daily Digest, 28Sep2020
Georgia COVID-19 Updates

The World
Globally, the SARS-CoV-2 virus that causes COVID-19 disease has sickened >33 million people (+2 million since last week) and killed 960,812 (+37,067 in the past week, which is larger than the week preceding it) as of this morning.

The US is a warm spot (not red hot as before), as is much of the Western hemisphere. However, we climbed one spot this week to 20th in the world for weekly case rate. Our weekly case rate per 100,000 is 96 (up from 88). Of the world’s recorded cases, the US has contributed 21.5% of them, despite making up just 4% of the world’s population. The state of Georgia alone has contributed 1% of the world’s cases, despite making up just 0.1% of the global population. Some of the hottest areas in the world for disease right now are in Europe, the Middle East and Central and South America.
For deaths, our weekly death rate per 100,000 decreased slightly to 1.6 (down from 1.7 last week) and we are ranked #20 in the world for this (down from #18 last week). The top five countries for death rates per 100,000 this week are Argentina, Sint Maarten, Bahamas, Montenegro, and Monaco.
The United States

As hot spots go, they are mainly concentrated throughout the Midwest. As of this morning, there have been over 7.1 million cases and 204,597 deaths in the US. Keep in mind that both of these numbers are probably an under-count of the situation in our country.
Georgia is ranked #28 in the nation for 7-day case rate per 100,000, a drop from #21 last week. This is really, really good news. However, since the state of Georgia only uses PCR testing to confirm and report cases, and probable cases identified using the rapid antigen test that has gained favor over recent weeks aren’t in that total. Meanwhile, 31 states *are* using rapid antigen test results in their case totals, including fellow southern states like Alabama, Florida, South Carolina, Tennessee, and Mississippi. It’s therefore not really a fair comparison and it’s very likely that our recent case totals are an under-representation of the disease that is circulating. Of the top 10 states for 7-day case rate per 100,000, none are in the South.
Georgia has no counties in the top 20 counties in the nation list for cases per 100,000 in the past week. Our highest ranked county is Stewart, ranked #27 (#12 last week). We also don’t have any cities in the top 20 for case rate per population.
University of Georgia is the #1 college/university in the nation right now for total cases among students, faculty and staff. The state of Georgia ranks #2 for college and university associated cases, behind Texas.
The New York Times Coronavirus tracker now includes a section on outbreaks and I was not surprised to see a lot of military, correctional facilities, and airport-associated clusters (TSA employees, in particular). It’s toward the bottom of this page.
According to the CDC, Georgia has a cumulative test rate of 26,047 per 100,000 residents and we are ranked 36th in the nation for this. If we look at percent positive rate using the map below, you can see that all of the South is experiencing a high rate, but for two weeks now, Georgia is now in the second color tier. Note that the CDC does not provide data on rapid antigen test results.

To look at more recent testing data, we have to go back to the New York Times resource. In the past week, it notes that Georgia increased in the rankings from 43rd in the nation (182 tests performed per 100,000 in the past 2 weeks) to 33rd in the nation (191 tests per 100,000). Together with the Harvard Global Health Institute, they estimate that Georgia is performing at 51% of the ideal testing target (up from 34% last week). We decreased testing last week by 9%, but the NYT/Harvard GHI tool uses two weeks’ worth of data, so we are still riding the high of the big rebound in testing we experienced the week before last.
Georgia is ranked #2 in the nation for proportion of inpatient beds occupied by COVID patients (12.02%), just behind Mississippi (12.32%) The top three states are all southern states (South Carolina = 8.64%). These data come from the Health and Human Services dashboard which was last updated on 23Sep.
Despite our declines in the rankings for case rate (a good thing), we have moved up in the rankings for death rate per 100,000 in the past 7 days, from #10 in the nation last week to #7. Southern states make up 5 of the 10 positions on that list, I’m sorry to say. If you remember, at the top of this section I indicated that nationally, we’ve had 204,597 deaths from COVID-19 to date and that it is likely an under-count. To get a better estimate of how deaths (of all causes) compare this year to previous years, we can look at excess deaths that are recorded by the CDC and quantified in a more user-friendly way by the New York Times. As of September 5th, the US has recorded 266,900 more deaths this year than what is considered typical. That’s a gap of 62,303 deaths compared to what were previously associated with COVID-19 and that death estimate precedes our current COVID death total by three weeks. I know there’s a lot of public anxiety of how trustworthy the reported numbers are. But if anything, the error is that we are under-reporting, not over-reporting. For Georgia, the gap is 1454 between the excess deaths for 2020 compared to our current COVID death toll.
CDC released a new study today on COVID-19 in school aged kids. In total, there have been 101,503 cases among elementary-aged kids (5-11) and 175,782 among children aged 12-17. Among the children who have been infected in these age ranges, 7,738 had at least one underlying condition (2.8% of all children in the study). The most common condition was chronic lung disease, including asthma. Since the start of the pandemic through September 19th, there have been 3,240 school-aged kids hospitalized, 404 ICU admissions and 51 deaths. For reference, as of that same date, Georgia had recorded 22,619 cases (8.2% of the national total), 285 hospitalizations (8.8% of the national total), and 5 deaths (9.8% of the national total) among this same age group. All that despite the state of Georgia’s total population comprising just 3.2% of the US population. In other words, our kids are being impacted disproportionately compared to other states in the nation. As of last Friday’s school-aged surveillance data report from DPH, they were investigating over 30 different outbreaks taking place in schools throughout Georgia. They do not provide details on where those outbreaks are occurring nor how many students, faculty and staff are infected, nor how many hospitalizations and deaths are connected to each outbreak. The state of Georgia famously informed the Atlanta Journal Constitution last week that “the public has no legal right to information about outbreaks that the state is investigating.”
Georgia
Here is how the state of Georgia is looking based on the risk tool from the Harvard Global Health Institute. The color coding is explained below the map.
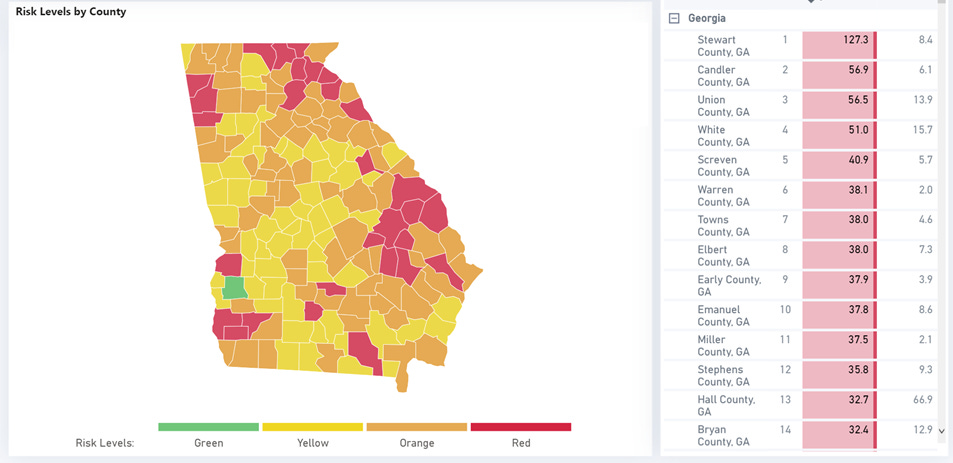

There is just one green county this week compared to four two weeks ago. Meanwhile, there are 57 yellow counties this week compared to 35 last week. So these include counties that shifted from the green zone (not good) and orange zone (forward progress). For yellow counties, there is community spread that might be manageable with adequate testing and contact tracing. These counties include some of our most populated ones such as Fulton. However, the remaining 101 counties have >10 cases per 100,000 people which are color-coded orange and red. The top counties are listed to the right of the map above. All but one of them are rural. The exception is Hall county, ranked #13 in the state. Red counties are primarily concentrated along the Georgia borders.
For today, here are the net increases for each key metric for Georgia.
Testing: 12,229 new tests (a very low day for us), 5.9% were positive. 120% of today’s cases were identified through electronic laboratory reporting (ELR), so there are some duplicate results in today’s report. The state counts tests regardless of whether they come from the same person in their calculation of percent positive rate - it is all positive tests divided by all tests performed (positive and negative). However, multiple positive tests from the same person are de-duplicated when case counts are tallied. So the case count is where the correction is made. Lately, we have seen very few cases being reported prior to the 14-day window of uncertainty. This indicates that we are seeing better turnaround time from test collection to test result and that people are doing better at seeking testing when they first experience symptoms. For our purposes, it tells us that the data we are seeing recently really are recent data. However, when we aren’t able to see what is happening with rapid antigen testing, it’s hard to make any conclusions about how the state is doing for testing or cases.

Cases: 596 cases (low count for us, probably due to weekend effect). The new statewide total is 315,281. Of today’s cases, 40% came from nonrural counties outside of the Atlanta metro. Atlanta Suburbs and rural counties were nearly equal, contributing ~24% each.
Hospitalizations: 18 new COVID hospital admissions and 7 new ICU admissions (these are low numbers for Georgia). We typically see low numbers on Mondays due to delayed reporting over the weekend. There are currently 1319 COVID patients hospitalized and this number is an increase of 32 over yesterday. Adult ventilators are being used at 30% of our state’s capacity.
There are three hospital regions that are over >90% ICU bed usage: regions H (95.3%), I (91.5%), and N (91.6%).
Deaths: 15 newly reported deaths (a low day, but higher than we’ve seen recently on a Monday). It should be noted that nursing homes typically do not report over the weekends, and Mondays tend to be low count days for this reason. Eleven of the deaths reported today came from outside of the Atlanta metro. The new statewide total is 6961. We will likely cross 7000 deaths in the next couple days.

The Georgia Department of Public Health began producing a new county indicators report that is available at the bottom of the daily report starting last week. The latest report was released today. The top counties of concern are listed below. Almost all are rural counties. But one of the counties is Fayette, one of the Atlanta suburb counties. Note, these are shown in alphabetical order, not disease rankings.

According to the state, almost all of the state is considered to have high disease transmission over the past two weeks (142 of Georgia’s 159 counties).

Also, the vast majority of the state is above the WHO testing goal of 5% (see all counties that are colored red or blue).

To summarize, Georgia appears to be doing better in many ways…but we aren’t really seeing an apples to apples comparison with other states since 31 of them are using rapid antigen test results in their case and testing totals (including most of the other southern states), whereas we are not. As the rapid antigen test gains favor among healthcare providers, our limited awareness of what that test is able to identify disease-wise in our own state makes it very difficult to know where hot spots are so that local communities can make informed decisions about public health interventions. This will have impacts on K-12 and higher education, businesses, communities of worship, and healthcare infrastructure. As we head into influenza season, the very last thing we need right now is to be blind as to where COVID-19 is circulating. We need rapid antigen test data from the state.
References
https://www.nytimes.com/interactive/2020/us/coronavirus-us-cases.html
https://www.nytimes.com/interactive/2020/world/coronavirus-maps.html
https://khn.org/news/lack-of-antigen-test-reporting-leaves-country-blind-to-the-pandemic/
https://globalepidemics.org/key-metrics-for-covid-suppression/
https://www.nytimes.com/interactive/2020/04/23/upshot/five-ways-to-monitor-coronavirus-outbreak-us.html
https://covid.cdc.gov/covid-data-tracker/#testing_testsper100k
https://dph.georgia.gov/covid-19-daily-status-report
https://covid-gagio.hub.arcgis.com/
https://www.cdc.gov/nchs/nvss/vsrr/covid19/excess_deaths.htm
https://www.nytimes.com/interactive/2020/05/05/us/coronavirus-death-toll-us.html
https://www.cdc.gov/mmwr/volumes/69/wr/mm6939e2.htm
https://epidemiologyschoolreport.s3.amazonaws.com/SchoolAgeSurveillance914.html#statewide-data
Georgia COVID-19 Updates is a free newsletter that depends on reader support. If you wish to subscribe please click the link below. There are free and paid options available.
My Ph.D. is in Medical Microbiology and Immunology. I've worked at places like Creighton University, the Centers for Disease Control & Prevention and Mercer University School of Medicine. All thoughts are my professional opinion and should not be considered medical advice.