The Daily Digest, 28Oct2020
Georgia COVID-19 Updates

Good afternoon! Today we’ll discuss the White House Coronavirus Task Force (WHCTF) report and the latest numbers from Georgia Department of Public Health. First, here’s the summary table from the most recent WHCTF report. We’ll go through many of these metrics in the following sections. You can read the full report at the Center for Public Integrity.

Testing
Georgia has always performed testing per 100,000 at a rate that was below the national average. However, recently that disparity is growing. We’ve held relatively steady over the past month while the rest of the country has increased.

Georgia continues to be above the national average for percent positive rate, however that disparity has narrowed over time. The percent positive rate should be considered alongside the case rate (next section). The latter tells us how much disease is circulating. The percent positive rate tells us whether that case rate is more or less likely to be an under count. The higher the percent positive rate, the more likely the case rate is under-representing the situation on the ground. You want to be at or below 5%, ideally. With the most recent month’s trends, it would seem that we close to testing enough, but not quite there. And now the percent positive rate is increasing for the state.
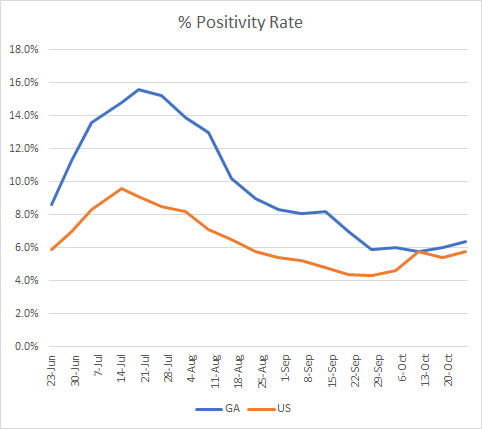
Today Georgia reported a net increase of 20,516 new PCR tests, a mid-range day for us. However, of today’s cases only 68% of them were reported through Electronic Laboratory Reporting. So today’s count of 20,516 is likely an underestimate and the percent positive rate might be an unreliable estimate as well. No word yet on when rapid antigen test results will make their appearance on the daily status report from DPH.
Cases
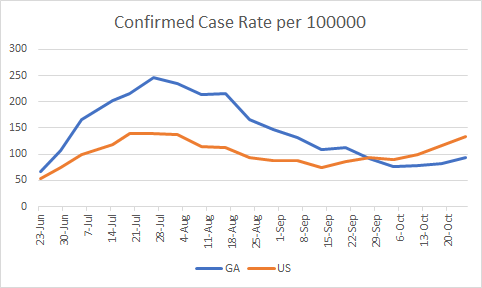
Here’s how Georgia has tracked for cases per 100,000 over time, compared to the US average. We have been below the national average since late September. But both the US rate and the Georgia rate are increasing.
This next graph is a little different. It tracks how many counties are on the WHCTF radar, or counties of concern. The WHCTF defines these counties based on recent case rates, and severity ranges from red (most intense) to yellow. There are color classes for counties that aren’t on the list (shades of green) to represent low case rates. The black line below is the total of all counties on the WHCTF list (red, orange and yellow).

For months now, we’ve been steadily decreasing the number of counties on the list. But that trend has reversed over the past two weeks. This week we saw an increase in red counties (+10 compared to last week). In all, 93 of Georgia’s 159 counties are on the WHCTF list of counties of concern.
Today Georgia reported a net increase of 1653 cases, bringing the statewide total to 355,025. The graph below shows you how things are moving for different county types. The state average (black line) obscures the lines for rural and Atlanta counties. They are tracking right along with the state average. Nonrural counties currently have the highest case rate per 100,000. These counties are those outside of the Atlanta metro with >50,000 residents.

Something else of interest is how the increases in cases are represented by different age groups. The two graphs below can be found in the DPH daily status report in the demographics area. We can see increases for adults aged 18 - 29 (yellow line) and 30-59 (red line) in the top graph.

To see what’s happening among kids, look at the lower graph. I’ve previously noted the increase in 10-17 year olds (purple line) but today I noticed that cases are increasing among 5-9 year olds too (red line).
Hospitalizations
Back to the WHCTF report, here’s what they’re tracking for hospital admissions over time for Georgia. The gray line shows how many Georgia hospitals have reported into the system (right y-axis), staying at or near 90% for the last several weeks. The left y-axis pertains to confirmed and suspected COVID-19 hospital admissions.

Confirmed COVID-19 hospitalizations have risen in a big way since 04Oct, but decreased slightly in the most recent week. These patients have already been tested positive for COVID-19 prior to admission. The suspected COVID-19 patient hospital admissions are those whose test results are pending at the time of admission, but hospitals are treating them as COVID-19 patients in the meantime. If we add these two together to get a better sense of the demand for treatment and personal protective equipment (PPE), the average daily number of admissions is 356 this week, an improvement over 389 last week. I had thought that the big jump around 11Oct was a typo or reporting error, but the number has remained high ever since. You’ll notice that the suspected line goes down as the confirmed line goes up. I think what this means is that we are getting better at testing patients in the hospital prior to admission, whether out in the community or in the ER prior to admission. That could be due to more rapid turnaround time for the PCR test in the hospital or the timing of when the rapid antigen tests really came online in Georgia. It’s around that time that Georgia began reporting rapid antigen test-identified cases in their weekly reports.
The next graph is a new one from the WHCTF report concerning the supply of personal protective equipment (PPE) at Georgia hospitals. I’ve included the graph for Georgia and Alabama below because I want to point out a stark difference. As of Sunday when this report was generated, >80% of Georgia hospitals have only 0-3 days worth of PPE on hand. Our neighbor, Alabama, and for most states whose reports are available show that about 80% of hospitals have 7-14 days worth of PPE on hand.

At first I thought the disparity in resources was due to allocation of resources to areas harder hit by the virus right now (i.e. Missouri, for example). But the same is true for Alabama whose case rate and hospitalizations are similar to Georgia’s. I’m not sure why Georgia has this problem with PPE supply, but it does not put us in a good position if the increases we are seeing lately evolve into a case and hospitalization surge. We’ll want to keep an eye on this as time goes on. PPE is necessary to keep our healthcare workers as safe as possible when taking care of the ill.
Today in Georgia there are 1419 patients currently hospitalized for COVID-19, 12 fewer than yesterday but 86 more than were hospitalized at this time a week ago. There were 114 new hospital admissions for COVID-19 and 29 new admissions to the ICU. Currently, 29% of adult ventilators are in use - similar to the rate prior to the summer surge, so this metric looks okay. There are five hospital regions using 90% or more of their ICU beds: hospital regions E (93%), G (90%), H (90%), L (90%) and N (93%). The map below shows how ICU bed usage varies across the state by hospital region. The more intense the shade of orange/brown, the higher the percentage.

Deaths
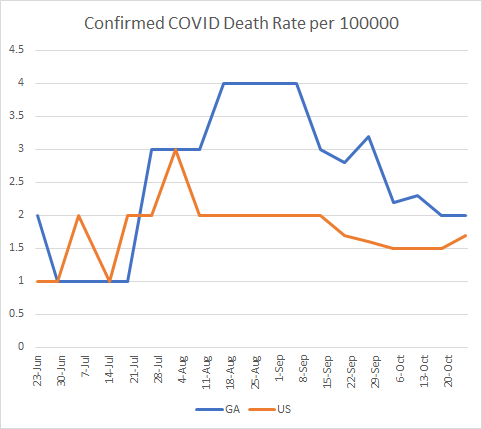
The death rate per 100,000 in Georgia has come down a long way since the summer surge. The gap between Georgia and the US has narrowed in a big way, partly because we’ve decreased and partly because the national rate is increasing.
Today Georgia reported a net increase of 32 deaths today, bringing the statewide total to 7876. Thirteen of the deaths came from rural counties and ten came from nonrural counties outside of the Atlanta metro. Below, you can see how the death rate has moved over time for different county types.

To wrap up, I’ll bring up some comments from the Recommendations section of the WHCTF report. First, they write, “the timeseries of maps at the back of your packet shows early signs of deterioration in the Sunbelt, now including Georgia, as mitigation efforts were decreased over the last month.” I was talking to a reporter about this today and neither of us could point to what they’re talking about. The governor of Georgia didn’t really change much to the existing strategy to curb infections. Instead, we both wondered if perhaps they were talking about us - ordinary people who had experienced enough pandemic fatigue to give up on adhering to the public health guidance. Unfortunately, we can’t ask for clarification - the WHCTF has no website, no point of contact, and getting these reports requires FOIA requests and open records requests to state governments.
The WHCTF goes on to say that “Georgia continues to see an increase in COVID-19 cases, increase in test positivity, and no declines in new hospital admissions week over week, suggesting early and expanding community spread.” They recommend surveillance testing in K-12 schools, screening teachers as an indicator of community spread among other interventions.
That’s it for today. Talk to you again on Friday!
References
https://publicintegrity.org/health/coronavirus-and-inequality/white-house-coronavirus-red-zone-reports-covid/
https://dph.georgia.gov/covid-19-daily-status-report
https://covid-gagio.hub.arcgis.com/
Georgia COVID-19 Updates is a free newsletter that depends on reader support. If you wish to subscribe please click the link below. There are free and paid options available.
My Ph.D. is in Medical Microbiology and Immunology. I've worked at places like Creighton University, the Centers for Disease Control & Prevention and Mercer University School of Medicine. All thoughts are my professional opinion and should not be considered medical advice.