The Daily Digest, 24Aug2020
Georgia COVID-19 Updates by Amber Schmidtke, Ph.D.

Good afternoon! Before I get into the usual Monday update that puts Georgia into the national context, I want to go over some of the latest data from the Georgia Department of Public Health.
First, there is a net increase of 2304 newly reported cases today and a whopping 51.7% of those were backdated prior to the 14-day window of uncertainty. I’m not sure I have ever seen this amount of backdating before. It tells us that there was more disease circulating during our July peak than we previously realized. For today’s new cases, 1290 (or 56%) came from nonrural counties that are not part of the Atlanta metro. Two hundred nine of today’s cases were in healthcare workers (or 9.1% of today’s cases). Keep in mind that DPH only gets data on a case’s profession sporadically. So this is likely an under count of reality. Cumulatively, there have been 14,989 infections among Georgia healthcare workers.

In addition, it was a bigger than usual day for testing but despite that today’s percent positive rate was very high compared to our recent trends, at 14.7%. That’s almost three times as high as we want it to be in order to contain the virus. Taking all of this together, it is possible today’s results are from laboratories clearing their backlog.
There were 24 newly reported deaths today, bringing the statewide total to 5156. Eleven of the deaths came from rural counties and 8 came from nonrural counties outside of the Atlanta metro. Nineteen of them were backdated prior to the 14-day window. That’s not unsurprising, considering how delayed death reporting can be.
There are ten fewer people in the hospital today than yesterday. That’s welcome news but it seems that our hospitalization decreases in the past couple weeks have leveled off for the past three days. Let’s hope they continue to trend downward.
Lastly, on a more personal note, this week and next are moving weeks for me. So I apologize in advance for not being as responsive to questions and email as I otherwise would be. Thank you ever so much for your patience.
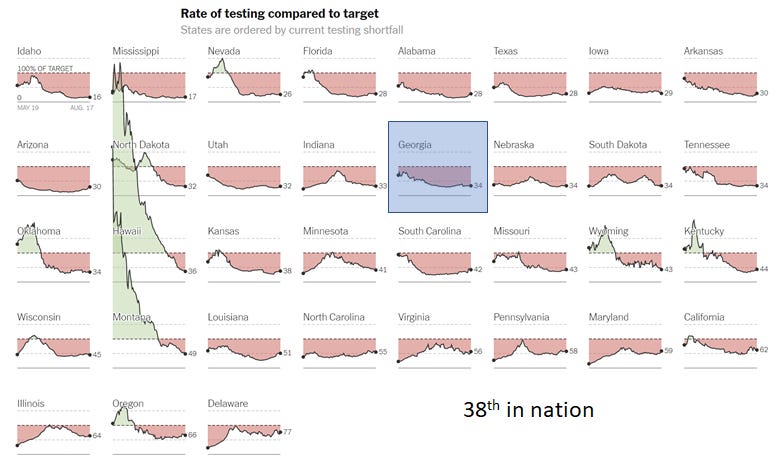
Testing
For testing, Georgia is only at 34% of the testing target we need to achieve to control this pandemic. The testing target is set by the Harvard Global Health Institute based on disease transmission, population and other metrics. We are currently ranked 38th in the nation for our progress toward this goal. Below you can see how other states who are short of the target compare.
Cases
The Western Hemisphere is the most heavily impacted region for average daily COVID-19 cases, adjusted for population. The United States is ranked poorly, alongside many developing countries. This map and the next come from the New York Times coronavirus map tracker, looking at cases per 100,000 in the past 7 days.

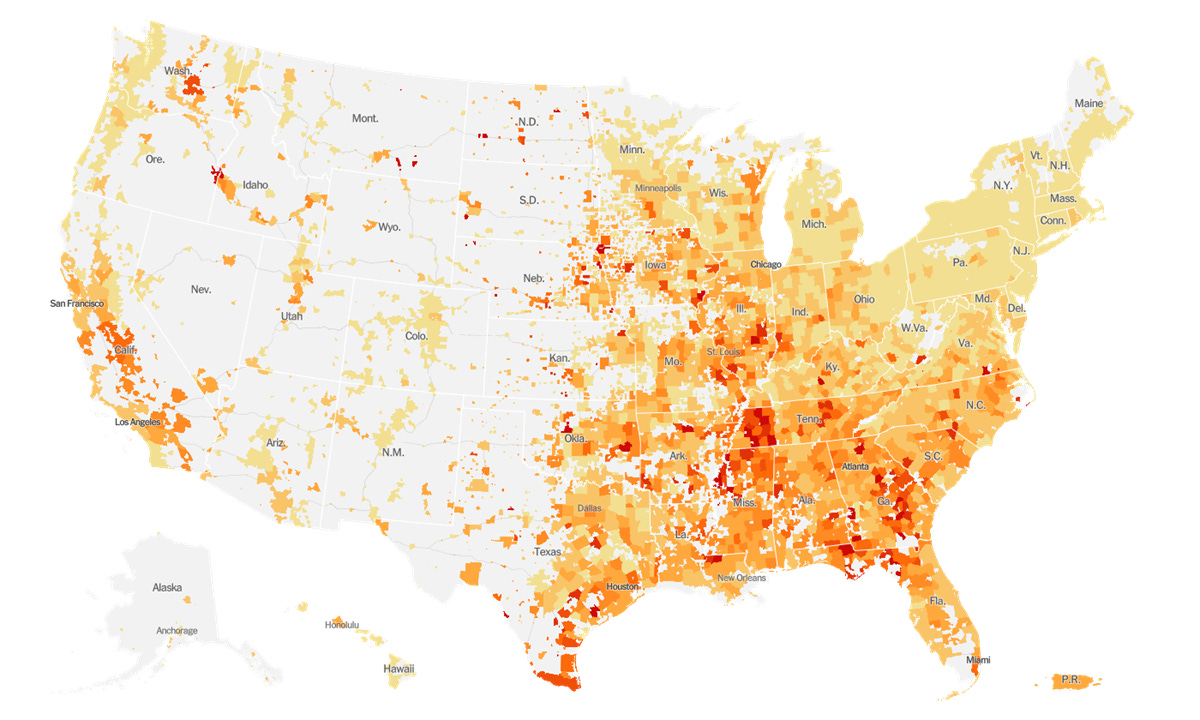
Within the US, the case hot spots (for daily new case rate per 100,000) are concentrated in the South with areas of increase in the Midwest as well.
When adjusted for population, Georgia is the 4th highest state or territory in the nation for cases per 100,000 in the past 7 days. The screenshot below is from the New York Times coronavirus tracker, which collects its data from each of the health departments for states and territories.

Looking specifically at Georgia, we are now ranked #3 in the nation for average daily case rate per 100,000 residents according to the Harvard Global Health Institute behind Mississippi and North Dakota. The eastern half of the state is especially hard hit.

Overall, 93.1% of the state’s 159 counties are in the orange or red categories which indicate that a shelter in place order is recommended or required, respectively, to adequately monitor and track the pandemic. In other words, 93% of the state’s counties (including our most populous ones) have disease transmission that exceeds their capacity to track and monitor. The Georgia Tech Event Risk Assessment tool ranks Georgia as #2 in the nation for disease transmission, after Mississippi.
For the New York Times top 10 county hot spots in the US, Georgia counties make up three of them.
Hospitalizations
The job of monitoring the US hospitalization data is allegedly going back to the Centers for Disease Control and Prevention after a very public and confusing back and forth with the Department of Health and Human Services. I, for one, am hopeful this means more regular updating. Because the frequency of updated maps and information on hospitalization has been irregular and for a time it didn’t update for nearly a week. But as of 20Aug, the most recent update to the HHS system indicates that Georgia is #1 for COVID-19 current hospitalizations, with 25.9% of all inpatient beds occupied by COVID-19 patients. The next highest is Mississippi at 17.2%. So while our hospitalizations have been going down within the state, we are still very, very high compared to the rest of the nation. In fact, we aren’t just high, we are two color categories above the next highest state.

Hopefully, the White House Coronavirus Task Force state report will be leaked again this week so that we can gain their valuable recommendations and also see how many of Georgia’s hospitals are reporting into this system. It’s possible that even this high percentage is an undercount.
Deaths
Deaths also decreased for Georgia last week, but we are still quite high for death rate per 100,000 in the past 7 days. Below you can see how the states are ranked by deaths per 100,000 in the past 7 days. Georgia is ranked #7. The South is heavily represented in the top 10 list, filling out 8 of the top 10. This is not a contest the South should want to win. These are preventable deaths.

In the past I’ve talked about excess deaths as a way of quantifying the impact of COVID-19, since in many ways we aren’t accurately capturing the pandemic’s impact for cases and deaths due to challenges with testing and reporting. Briefly, excess deaths looks at the total number of deaths this year (regardless of cause) and compares those numbers to the expected trend based on previous years data. You can explore excess deaths in terms of total counts, percent change, age and race, etc, by visiting this tool at CDC. Data are shown below for Georgia. We have peaked above the threshold before in January 2018 - attributed to a particularly bad year of seasonal influenza. But unlike a bad year of influenza, our experience with COVID-19 has been associated with greater and more sustained increases in excess deaths. We haven’t had a natural disaster or other event that could account for this surge above the threshold, other than the COVID-19 pandemic.

New York Times took the CDC tool and quantified it for each of the states and territories. For Georgia, they calculated 5700 excess deaths from the period of March 15 - Aug 8 above our usual trend, an increase of about 17% over threshold. According to Georgia Department of Public Health, the adjusted amount of COVID-19 deaths as of August 8th was 4713.

So to summarize, things are better than last week in many ways. But we are still far higher than we should be comfortable with. We really should be doing all we can to decrease transmission of the disease to others.

References
https://globalepidemics.org/key-metrics-for-covid-suppression/
https://covid19risk.biosci.gatech.edu/
https://www.nytimes.com/interactive/2020/world/coronavirus-maps.html
https://www.npr.org/sections/health-shots/2020/08/20/904450628/white-house-stokes-hopes-that-key-hospital-data-tracking-will-soon-return-to-cdc
https://www.nytimes.com/interactive/2020/us/coronavirus-us-cases.html
https://www.cdc.gov/nchs/nvss/vsrr/covid19/excess_deaths.htm
https://dph.georgia.gov/covid-19-daily-status-report
http://208.97.140.204:8080/epicurveInteractive-cases.html
https://www.nytimes.com/interactive/2020/us/coronavirus-testing.html
Georgia COVID-19 Updates is a free newsletter that depends on reader support. If you wish to subscribe please click the link below. There are free and paid options available.
My Ph.D. is in Medical Microbiology and Immunology. I've worked at places like Creighton University, the Centers for Disease Control & Prevention and Mercer University School of Medicine. All thoughts are my professional opinion and should not be considered medical advice.