The Daily Digest, 16Sep2020
Georgia COVID-19 Updates
The latest White House Coronavirus Task Force (WHCTF) report on Georgia has been leaked and made public by WABE news in Atlanta. I’ll be unpacking that report along with analysis of the latest data provided by Georgia Department of Public Health.
First, here’s the summary table from the WHCTF report, dated 13Sep2020.

We’ve seen encouraging drops in case rate and death rate. However, our test positivity rate is about the same as last week and our testing output (tests per 100,000 residents) plummeted by 44.6%. The recommendations continue to focus on the threat posed by university and college campus disease transmission both within the student body, faculty and staff, but also the surrounding communities that host them. In addition, the WHCTF is asking Georgians to limit all social gatherings to 15 or fewer people. For the second week in a row, there is no longer a recommendation for a mask mandate.
Testing
As the summary table from the WHCTF report indicates, our testing output per population declined by 44.6% last week compared to the week prior. This is not a number we should be proud of. As we reopen K-12 schools and colleges and universities, settings where outbreaks are predicted to occur, we should be doing more testing to identify outbreaks before they have the chance to explode beyond containment. That we are doing slightly more than half of the testing we were doing last week is a bad sign. Below, you can see how this testing rate compares to our history and to the US. Where the US has been steadily increasing its testing output over time, Georgia has increased and decreased with greater variation. During the height of the summer surge, we were doing less testing than we did in August. Rather than moving closer to the national average (which is still less than the target), we are expanding the gap between national testing and state testing.

Meanwhile, our percent positive rate for PCR tests has remained flat while the nationwide rate has continued to decrease. So we are moving away from the national average on this metric also.

For Georgia, it was a back to what used to be an average kind of testing day (25,031 new results through ELR) after several days of low output. Of those tests, 10.8% were positive. This is higher than Georgia has recorded in recent weeks, but I don’t think it’s a reason to panic. It’s possible this day’s batch of testing included more symptomatic individuals who are more likely to test positive, for example, as labs are now reporting their weekend backlog.
Cases
With our testing output at just over half of what we were doing last week, it’s hard to know whether our case declines are an artifact of reduced testing or a true decline in disease. Based on the data we have, the state is coming closer to the national rate of disease when looking at cases per 100,000 residents. Below you can see how the rates have compared over time.

We have always been higher than the national rate. But we are narrowing that gap. this week our case rate is 108 per 100,000 whereas the national rate is 74 per 100,000.
Below we can see how many counties are in the red or yellow zones over time. The combined total is shown with the black line.

Our number of counties in the red zone is declining (a good thing). But it seems like a lot of those counties just shifted to the yellow category in recent weeks. The overall effect is a decrease in counties that are either red or yellow.
Today was a higher than recently typical case reporting day, with a net increase of 2223 newly identified cases. Here’s how they broke down by county type:
Nonrural: 35.3%
Rural: 25.6%
Atlanta suburbs: 18.4%
Atlanta: 10.6%
Non-Georgia resident: 9.7%
Unknown: 0.5%
If we look at the 7-day case rate per 100,000 for each county type, we seem to have hit a leveling point that might just be a bump on the continued trajectory down. We need more time to know. One thing we can take away from this graph is that our case rates can shoot up very, very fast. But they do not decline at the same rate. Nor have we returned to where disease trends were prior to the summer surge.

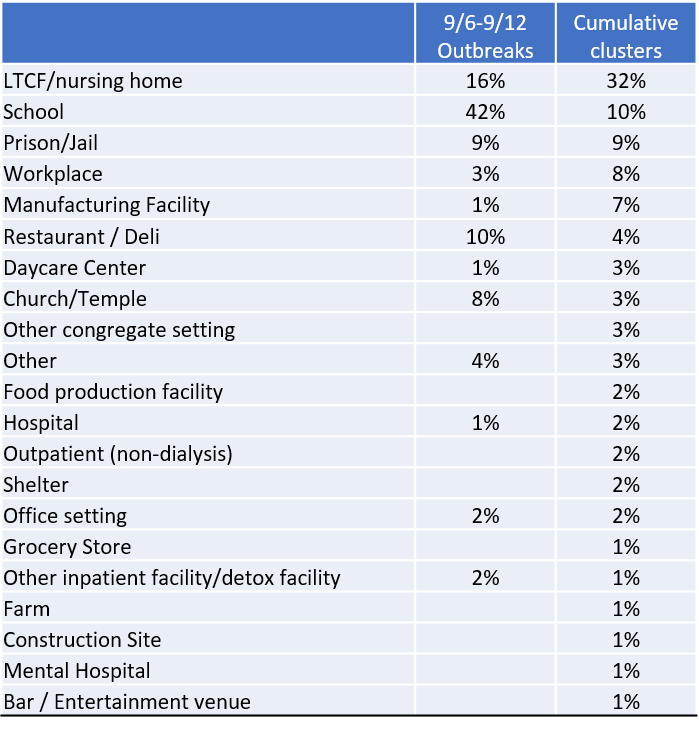
The Department of Public Health issued a new press release today with a report of positive indicators. A lot of it is things I’ve already talked about but their maps showing relative increase and decrease among counties are new and helpful. Toward the end, they provide a section called “Outbreaks” where they list how many clusters have been identified during the week of 06-12Sep and since the start of the pandemic. This is vital information that I hope DPH will be able to continue to provide in the future. In total, there are 93 outbreaks for the reporting period of 06-12Sep and 2207 since the start of the pandemic. Here’s where the most outbreaks are taking place:

In the most recent week, the largest source of outbreaks was schools (42%) and by a large margin. The report does not discriminate K-12 versus college/university. The other top sources were nursing homes (16%), restaurants and delis (10%), prisons/jails (9%) and church/temple (8%).
Since the start of the pandemic, the number one source of outbreaks has been nursing homes. Considering that schools only recently went back to face to face instruction, that they have already reached the #2 position for contributing to outbreaks means that there have probably been multiple weeks where schools have had outbreaks in order to overtake the positions of things like prisons and jails, restaurants, and food processing plants that we know were driving outbreaks in the beginning of the pandemic. We do not have any additional information on these outbreaks, such as whether the school had a mask policy, or not, and how many kids, teachers and staff were affected.
Another thing that was noteworthy was that there have only been 7 clusters to date associated with military facilities and none were during the reporting week. Much has been made of the increase in cases in Chattahoochee county being attributed to Fort Benning, and especially recently. If so, we should have seen at least one cluster last week or perhaps more than 7 incidents. A couple possibilities are under reporting (the military probably doesn’t want to divulge information that pertains to readiness) and that perhaps some of these are long-running, continuous outbreaks that haven’t really ended.
Hospitalizations
Hospitals reporting into the WHCTF data stream are stabilizing above 80%. Hospitalizations for the state are leveling off after weeks of decrease according to the WHCTF report. This could be a temporary thing before hospitalizations decline further, or it could be where we bottom out. It’s too soon to know for sure. But confirmed hospitalizations have held relatively steady for the past two weeks.

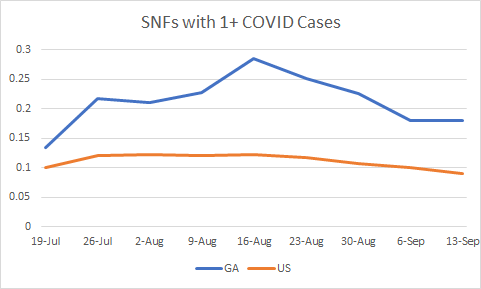
Looking at the percentage of skilled nursing facilities (SNFs) with at least one COVID case, our rate is the same as last week while the national rate declined. Meanwhile the governor has issued a new executive order to allow nursing home visitation once again. Given how many outbreaks have been associated with these facilities, we should prepare for our percentage to increase.

COVID Hospitalizations have been decreasing over the past several weeks, but have recently started to trend upward again. Here’s how new admissions have varied over time. The orange dashed line is the 7-day moving average to help us see the trend through the day to day variation.

Similarly, things are starting to move up again for new COVID ICU admissions. We’ve seen this happen before (see the trend line around 12Aug) and it could just be that variation before continuing to decline. We need more time to know.

Here is how bed capacity in ICUs compares across hospital regions in the state. Keep in mind, these data aren’t COVID-specific.

Deaths
Some really good news in the WHCTF report is that our death rate has declined after being twice the national rate for three weeks.

There was a net increase of 21 newly reported deaths today, a low day for us. Ten came from nonrural counties outside of the Atlanta metro, another 7 came from rural counties. The total number of deaths for Georgia to date is 6419. Deaths do not receive any mention in the Department of Public Health trend report released today.
References
https://www.wabe.org/wh-report-some-progress-slowing-in-georgias-coronavirus-fight/
https://www.ajc.com/politics/politics-blog/kemps-new-order-paves-way-for-in-person-nursing-home-visits/IWQLOCYURJHULKINXF4D4VKIKQ/
https://dph.georgia.gov/document/document/dphnewsrelease-covid-19update9-15-2020pdf/download
https://www.ledger-enquirer.com/news/coronavirus/article245270165.html
https://dph.georgia.gov/covid-19-daily-status-report
https://covid-gagio.hub.arcgis.com/
Georgia COVID-19 Updates is a free newsletter that depends on reader support. If you wish to subscribe to my newsletter, Georgia COVID-19 Updates, please click the link below. There are free and paid options available.
My Ph.D. is in Medical Microbiology and Immunology. I've worked at places like Creighton University, the Centers for Disease Control & Prevention and Mercer University School of Medicine. All thoughts are my professional opinion and should not be considered medical advice.

Hi! I'm curious what constitutes an "outbreak"? I tried looking at the press release you mentioned but I did not see anything. Do you have any idea?