

The Daily Digest, 16Oct2020
Georgia COVID-19 Updates

Today we’ll discuss the latest numbers from Georgia, including the latest school-aged surveillance data report.
But first, a new report is out from NPR that looks at how many contact tracers are on staff right now across the country. There have been increases since the spring, but most states do not have the workforce needed for contact tracing and Georgia is among them. Researchers at George Washington University estimate that Georgia needs 4,634 contact tracers, but we only have 1,600. That’s 15.21 contact tracers for every 100,000 people in the state. As you can imagine, that’s not enough when cases surge. The GWU team also found the threshold above which contact tracers tend to get overwhelmed - it’s 10 cases per day, per 100,000 people. Even now, when things are relatively calm in Georgia, we have 98 counties that are above that daily case rate. Many states across the country are unable to hire enough contact tracers, in part because of state budgets that have been hurt by the economic fallout from the pandemic. With a relief bill stalled in Congress, and the President’s team abandoning the effort, the contact tracing workforce isn’t likely to increase any time soon. Many states were counting on that relief bill to expand capacity for coping with the pandemic. It unfortunately means that we are less prepared for the anticipated surge in cases this winter. So what can you do to help contact tracing efforts?
Avoid unnecessary errands and gatherings. Limiting your exposures makes it easier to perform a contact trace investigation, if needed.
Keep a journal of your encounters each day along with any symptoms you may notice, even if you assume it’s something unrelated, like allergies. If you test positive at some point, you can let those with whom you interacted with during your infectious period know that they may have been exposed.
Answer phone calls, even if they are from unfamiliar phone numbers. Let’s make a contact tracer’s work as efficient as possible.
Testing
It was a pretty average day for testing. There were 24,489 new test results reported through Electronic Laboratory Reporting (ELR). Of those, 6.2% were positive. It was a good reporting day, with 94% of today’s newly identified cases reported through ELR. So the 6.2% positive rate is likely a reliable estimate of the situation. Keep in mind that this positive rate only concerns PCR testing, not antigen testing. Of today’s newly identified cases, only 8.4% were reported prior to the 14 day window. So today’s newly identified cases are mostly recent or current.
Here’s how our percent positive rate looks over time. Again, this graph includes just PCR test results.
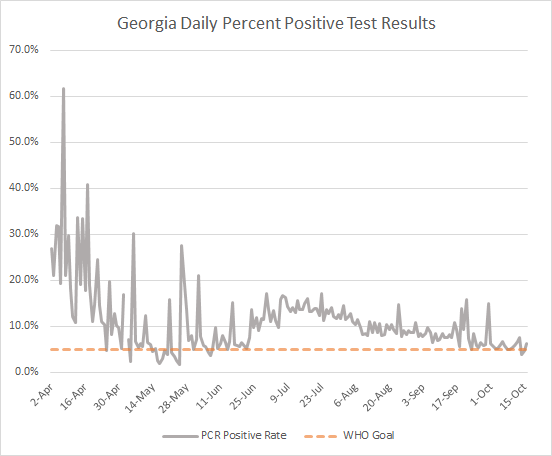
We are at a better position than we have been since the beginning of the summer surge. However, as the antigen test gains in popularity and use, this metric might matter less in the future.
Cases
Today there were 1609 newly identified cases, increasing the statewide total to 337,850. Of today’s new cases, 46% came from nonrural counties outside of the Atlanta metro. Atlanta suburbs and rural counties each contributed 28% of today’s new cases. There was a substantial reduction in both the unknown category and the non-Georgia resident classification. The reduction in the unknown category might reflect that the state is clearing through some of the contact trace investigations. Here’s an updated look at how case rates compare between county types and the state.
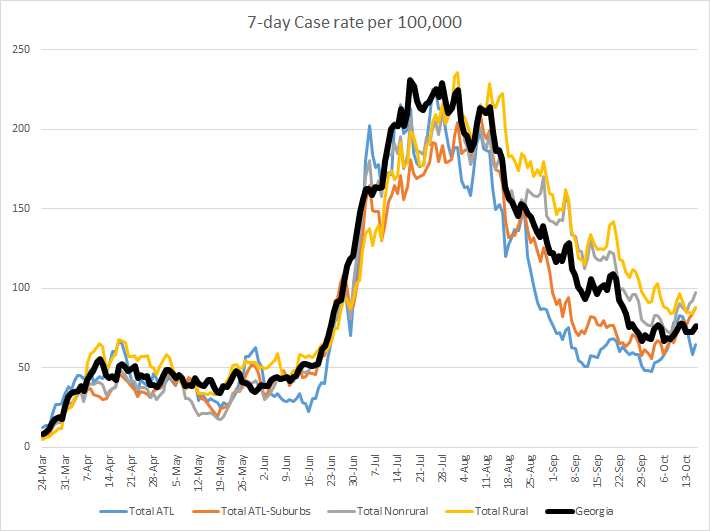
It is possible that we have bottomed out on our descent from the summer surge. If so, we remain at a case rate per 100,000 that is 95% higher than the case rate prior to the summer surge. That means there’s a lot more opportunity for cases to surge and higher than we’ve seen before. Nonrural counties have a case rate per 100,000 that is 29% higher than a week ago. Currently, they have the highest case rate per 100,000 in the state.
From today’s school-aged surveillance data report, cases rates are increasing among 18-22 year olds, while remaining relatively steady for children and older adults. This is concerning because the summer surge began with cases increasing in this same age group. It’s too soon, however, to know whether something similar will happen in the coming weeks. As is often the case, the situation makes more sense as we look back than if we try to make predictions going forward.

Lastly, here’s a look at how COVID-19 outbreak clusters have been associated with school settings (includes K-12 and college/university together) over time.

We’ve seen a growth in the number of daycare-associated clusters in the most recent two weeks. The total number of clusters is comparable to what it was a few weeks ago, at about 35 new clusters reported in the last week alone.
Hospitalizations
As hospitalizations go, things are steady compared to where we’ve been for most things. There were 136 COVID patients newly admitted in the last 24 hours and 34 were admitted to the ICU. Both of those numbers are in keeping with numbers we see during the week. Adult ventilators are in use at a rate of 29%, which is comparable to where we were prior to the summer surge. The one thing that stands out right now is the number of currently hospitalized patients.

The increase looks slight on this graph because of how high we’ve been in the past, but the number of patients currently hospitalized for COVID-19 is 98 people higher than we were a week ago. After months of declines, it’s troubling to see any increase, much less a sustained one that has lasted four days. The map below shows how each hospital region is impacted by COVID-19 patients today. Click on the image to explore your region, since the colors sort of aren’t very helpful right now. The area hardest hit is in Central Georgia, region H, with 21% of hospitalizations being for COVID-19 disease. Second is region A, in northwest Georgia, with 19% of hospitalizations due to COVID-19 illness.

Today there are only two hospital regions that are using >90% of their ICU beds: regions E (90%) and H (92.3%).
Deaths
It was a high day for deaths, especially relative to where we’ve been recently. There were 64 newly reported deaths compared to yesterday, bringing the statewide total to 7556. We haven’t had a day this bad since September 23rd. Of today’s newly reported deaths, 48% came from rural counties that have been hit disproportionately hard. Nonrural counties outside of the Atlanta metro contributed 20% of today’s deaths. In other words, 68% of the deaths are happening outside of the Atlanta metro, in spite of the population density in Atlanta that might encourage disease spread opportunities. Here’s the updated graph showing death rate per 100,000 over time for the different county types.
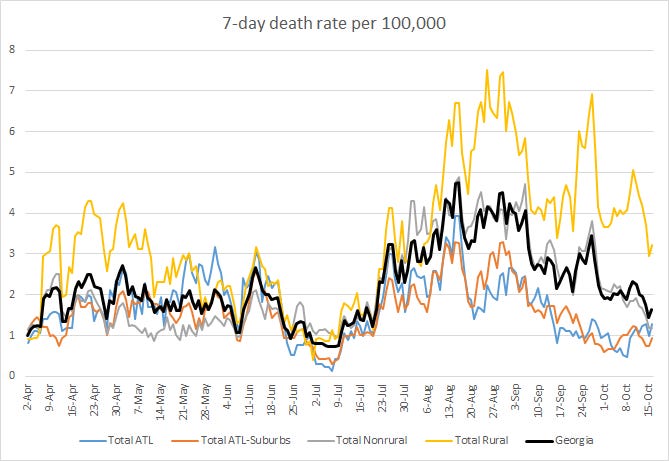
The death rate for rural Georgia counties is 96% higher than the state average. The death rate in Atlanta counties (Fulton and DeKalb) has increased over the past week, at a rate of 22%.
That’s it for today. Have a safe, socially distanced, weekend.
References
https://dph.georgia.gov/covid-19-daily-status-report
https://covid-gagio.hub.arcgis.com/
https://www.npr.org/sections/health-shots/2020/10/14/923468159/covid-19-contact-tracing-workforce-barely-inching-up-as-cases-surge
https://epidemiologyschoolreport.s3.amazonaws.com/SchoolAgeSurveillance1005.html
https://gagio.maps.arcgis.com/apps/opsdashboard/index.html#/e40c39564f724af7bfe8fd5d88deadb6
Georgia COVID-19 Updates is a free newsletter that depends on reader support. If you wish to subscribe please click the link below. There are free and paid options available.
My Ph.D. is in Medical Microbiology and Immunology. I've worked at places like Creighton University, the Centers for Disease Control & Prevention and Mercer University School of Medicine. All thoughts are my professional opinion and should not be considered medical advice.