

The Daily Digest, 15Sep2020
Georgia COVID-19 Updates

New Data Alert!!!
It’s my day “off” but a colleague at Georgia Department of Public Health made me aware of some new data available to the public now from their main site (not the daily report), toward the bottom of their page, titled “School Aged COVID-19 Surveillance Data.” There’s a lot of data to unpack here. But I wanted to give you some pointers on how to navigate the new report, that will be updated weekly, and then send you off to explore data for your own county.
The first page will look like this:

It’s full of definitions and navigation tools. For example, how do they track emergency department visits and what’s the difference between tracking COVID versus ILI (influenza-like illness)? More reminders that they only use molecular (PCR) based testing to confirm a result - they do not use the point of care or rapid antigen tests to confirm a case.
Statewide Data Tab
If you’re a data nerd, buckle up. It’s about to get fun. A note: on the Statewide Data tab, none of the graphs are clickable…meaning you can’t click or hover over a data point to get its actual value. There is some clickable information on the third tab.
The first graph looks at cases by age category. Keep in mind, these are total counts, not adjusted for population. That comes next. The x-axis shows each week. The y-axis differs between the two graphs (pay attention to this).
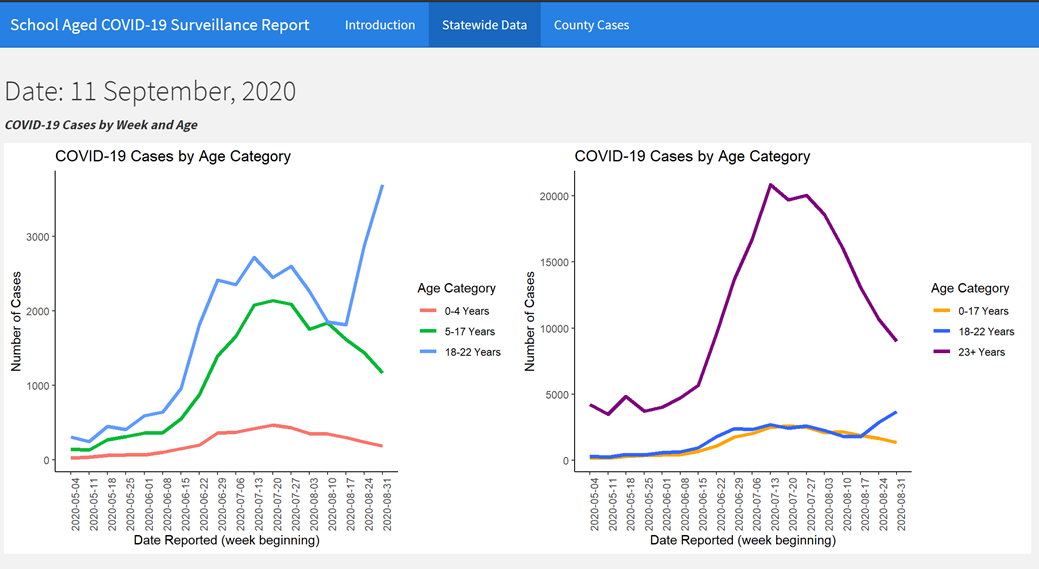
On the left, we are looking at people up to age 22. The color categories are broken down by non-school aged kids (0-4 years old), school-aged children (5-17) and college/university aged adults (18-22). You’ll notice that the college age population has skyrocketed in cases recently and is even higher than during the height of the summer surge. The extent to which this is due to return-to-campus screening or diagnosis of acute illness is unclear. On the right, we see a different set of ages. Yellow represents pediatric cases (0-17). College/university aged population is in blue. The rest of the adult population is shown in purple. Because these are total counts, the college age group and the pediatric ones seem very small by comparison. But that’s because they’re a smaller part of the overall population. Next, let’s look at population-adjusted data.

The graph and color coding is the same setup as before. The x- and y-axes are the same for both graphs in this case since things are adjusted for population. The left graph again shows pediatric and college-aged populations. Now that it’s adjusted for population, we can see that cases among 18-22 year olds are much higher than pediatric cases (note that the green line is down by the red one now). On the right, we can see how the college-aged population compares to children and older adults. They are the highest contributor to disease in our state since late May and have a rate that is roughly 4 times higher than any other age group.
Looking more deeply at cases within the school-aged population, they have color coded children based on elementary age (5-10 years), middle school (11-13 years) and high school (14-17 years). Again, these are total counts, not adjusted for population. The x-axis shows weekly data.

Even before school started, during the summer surge, we were seeing cases among school-aged children. Their rate of increase and decrease more or less mirrors what we saw for the state overall. The majority of pediatric cases have been consistently among high-school aged kids.
Next we can see total counts of hospitalizations by age group. There are two additional age categories compared to the previous bar graph: those too young to attend K-12 schools (0-4 years old), and college-aged adults (18-22). Note that this graph is NOT adjusted for population.

What we see is that the hospitalizations are greatest among college-aged adults compared to the other age groups. But hospitalizations are also greater among high school aged kids compared to elementary and middle school aged kids. There are two graphs that look at emergency department visits based on COVID or influenza-like illness but I’m going to skip those for now for the sake of space on this post. Just note that the y-axis for both graphs is looking at percent of ED visits, not total counts.
Let’s look at how testing compares for different age groups. The red line depicts total tests performed. The blue/green line depicts positive tests. A really important thing to note here is that the y-axis is different for each of these graphs. So don’t look at these and assume that testing is more or less equal among these populations. The 0-4 age group maxes out at 3000 tests on the y-axis. The 5-17 year group has a bigger y-axis, maxing out at 10,000. For 18-22 year olds, the y-axis maxes out at 15,000.

Next, let’s look at how percent positive varies by these same age groups. Keep in mind that the goal is to be at or below 5%.

Percent positive rate is an important thing to track alongside case rate per 100,000. Because the case rate tells us how much disease we are currently able to detect. The percent positive rate tells us how much of that case rate is likely to be an under count of reality. The higher the rate above 5%, the more likely it is that we aren’t testing that population enough and we are only capturing the tip of the iceberg, so to speak. All of these percentages are above 5%, especially recently. So rather than just having an open door policy of anyone who wants a test can get a test, it might be a good idea for the state to target testing to the school/daycare/college populations where disease clusters are likely to begin.
We’re almost done with the second tab. Toward the bottom is a table with data that compare total data with recent data for some of the age groups. Where cases have been decreasing among 0-17 year olds by 18-20% in the past week, they are moving the opposite direction for college-aged adults (+28.4%). Just note when you’re looking at this table that the columns seem counterintuitive. The current week’s data is presented first followed by last week’s data.

The last thing to see on this tab is the number of outbreak clusters associated with schools and daycare centers over time. According to the Introduction tab, this graph also includes higher education clusters in the “school” category.

The majority of cases are associated with schools since July 20th. Prior to that time, there was a more even or lopsided distribution to daycare centers since schools closed this spring. These clusters were predicted to occur with the reopening of K-12 schools and colleges and universities. But predictable does not equal acceptable.
County Cases
We are almost to the part where I set you loose to go explore your county. The third tab shows a snapshot of the data we looked at on the Statewide Data tab but for each county. The headers to the columns do not scroll with you when you find your county so it can be confusing to remember what each column is tracking. For that reason, I recommend that you enter your county of interest in the top left box (default setting is “all”). I’ve entered Clarke county for us as a demonstration. It will pull up the data just for that county.

We see four rows that show data broken down into age categories: 0-4, 5-17, 18-22 and 23+. So that’s our pediatric populations broken down into school aged and non-school aged, college-aged population and everyone else. There is a bar graph (also known as a histogram) that shows how cases have varied for that population for the past 30 days. The most recent dates are on the right. Next we see cumulative cases to date, 14-day case count (recent history is probably more relevant than March/April data), 14-day rate adjusted for population and whether the state considers that rate to be high (>100 cases/100K), moderately high (>50-100 cases/100K), moderate (10-50 cases/100K), or low (0-10 cases/100K). The last column indicates whether disease rate is increasing, decreasing, or more or less the same compared to last week.
For Clarke county, the example we’re using here, you’ll notice that cases have been relatively steady among 0-4 year olds and increasing slightly among 5-17 year olds. However, cases are increasing in a very big way for 18-22 year olds. For the remainder of the adult cases there seems to be less variation. Remember, these bar graphs are not adjusted for population. So it’s not a good idea to compare the trend among 0-4 year olds and 5-17 year olds, for example. Instead, it’s useful for looking at trends within an age group. So, for example, the way that 18-22 year olds are increasing over time. But it might not be correct to say that there is more disease among 18-22 year olds than any other age group for two big reasons: (1) we don’t have a y-axis to know how comparable these groups are, and (2) there are a lot more people aged 23+ than there are 18-22. So just be careful about drawing conclusions from these data. For Clarke county, 14-day disease rate is identified as “high” and increasing for all age groups.
Please go explore what is happening for your county. Let me know if you have questions!
I hope this walk through helps you to better understand how to read the graphs and tables the Department of Public Health is now providing.
If you wish to subscribe to my newsletter, Georgia COVID-19 Updates, please click the link below. There are free and paid options available.
My Ph.D. is in Medical Microbiology and Immunology. I've worked at places like Creighton University, the Centers for Disease Control & Prevention and Mercer University School of Medicine. All thoughts are my professional opinion and should not be considered medical advice.