The Daily Digest, 15Feb2021
Georgia COVID-19 Updates

Vaccine Update
We can see how the US (and Georgia) is doing with respect to the vaccine administration effort using the CDC’s COVID-19 Data Tracker understanding that delayed reporting can affect the numbers. Nationally, 75.5% of the available doses have been administered, either as a first or second dose. And Georgia’s usage rate is just behind the national rate, 71.2%, according to the CDC. Some of the more successful states, such as West Virginia and New Mexico, have used 98% of the doses that have been delivered. While we wait for supply to increase, it is vital that we make the most use of the vaccine we *do* have. So, of course, I would prefer to see Georgia’s percent administered be much, much higher, especially considering the emergence and growing dominance of more transmissible variants of the virus. Hopefully the remaining doses have an appointment to meet their recipient in the coming days. Of those who have started the vaccine series in the US, 37% have had their second dose (last week 29%).
Georgia’s 1+ dose vaccination rate has increased 12.7% in the past week, which is good news but not as good as the previous week (+44%). We seem to be slowing down but maybe this is an artifact of reporting delays to CDC. 380,394 people have completed the 2-dose series in Georgia (3.6% of the GA population). The low end estimate for achieving herd immunity is 70%. So we’re still a long way off. It is great to see that upward momentum. Georgia lost some ground this week, moving down from #38 to #46 in the nation this week, with a 1+ dose vaccination rate that is 9679 per 100,000 residents. The top three states for first doses administered per 100,000 residents are Alaska (17276), West Virginia (13821), and New Mexico (13665). The bottom three states are Rhode Island (9192), Utah (9578), and Tennessee (9655). This week, Georgia has administered 1+ doses per 100,000 at a rate that is 44% less than the leader (Alaska). Last week the difference was 41% higher. So we’ve lost some ground.
The World
According to the New York Times Coronavirus Tracker, the SARS-CoV-2 virus that causes COVID-19 disease has sickened >108.9 million people (+2.7 million since last week) and killed at least 2,401,100 (+83,700 in the past week) worldwide as of this morning.
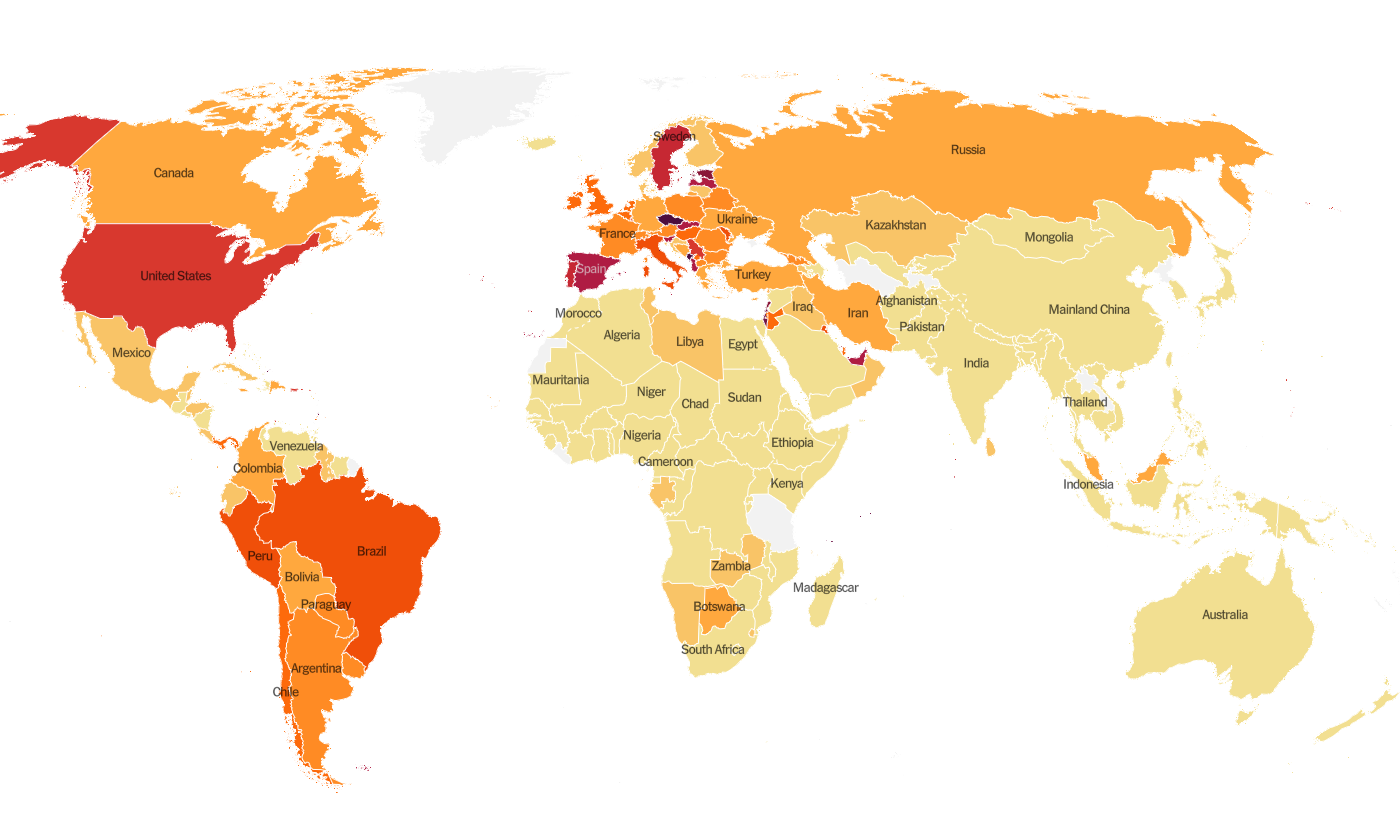
Things have improved a lot for this map - it’s not nearly as colorful as it has been in recent months. We are ranked #24 in the world for average daily case rate per 100,000 people over the past 7 days (last week #19) with a rate of 27 compared to 36 last week. So our case rate has improved. The top five countries for average daily case rate per 100,000 in the past week are Montenegro, Czech Republic, Turks and Caicos Islands, San Marino, and Israel.
For deaths, the US average daily death rate per 100,000 over the past week is 0.78 (previous week was 0.85), and we are ranked #14 in the world for this (last week we were ranked #13). The top five countries for average daily death rate per 100,000 in the most recent week are Portugal, Slovakia, Turks and Caicos Islands, San Marino and the Czech Republic.
The United States

The map above comes from the New York Times Coronavirus Tracker. As of this morning, there have been over 27.6 million cases (+600,000 in the past week) and 485,154 deaths in the US (+21,816 in past week). Keep in mind that both of these numbers are probably an under-count of the situation in our country.
According to data from the 14Feb21 HHS Community Profile Report (the source document for the White House Coronavirus Task Force reports), the top five states in the nation for new case rate per 100,000 residents are South Carolina, Oklahoma, New York, New Jersey and Delaware. Georgia is ranked #11. The top five states in the nation for new death rate in the past 7 days are Ohio, Alabama, Arizona, Kansas and Delaware. Georgia is ranked #8.
The table below tells you where we are this week and how that compares to the previous week (in parentheses). The data for everything comes from the HHS Community Profile Report from 14Feb2021.

Georgia has the top spot for the percentage of hospitalized patients who are being treated for COVID-19. We are just outside of the top 10 for case rate and death rate. Test output dropped 45% (!!!) last week though and we are in the red zone for this metric. You can’t find disease when you’re not looking for it. And this isn’t hide and seek. The virus doesn’t care if we are aware of its movement. But we absolutely should care and should be doing our best to know who has it and work to isolate those people, especially with the more transmissible variant estimated to be widespread in Georgia.
Georgia
I’m sharing the map that’s formatted the same way as the Brown University School of Public Health tool but includes Georgia’s antigen cases. There hasn’t been much point in sharing it in recent weeks because the entire state was labeled red (the highest risk category. This week there are 90 counties in the red category, 66 in the orange category and 3 in the yellow category. You can click on the map below to see the live image that allows you to click/hover over your county. The red counties are clustered in the northern half of the state, along the coast and along the borders. The center and southern half of the state are in better shape.

Let’s discuss today’s numbers for Georgia.
Testing: a really low day for PCR testing, lower than most Mondays we’ve had recently. There were 17,616 new PCR results reported, 11.1% of which were positive. Antigen testing identified 16% of today’s cases.
Cases: cases are often lower on Mondays due to weekend effect. Today there was a net increase of 2070 newly reported cases (1730 by PCR, 340 by antigen test). Of today’s newly reported cases, 33% each came from Atlanta suburb counties and nonrural counties outside of the Atlanta metro.
In Friday’s newsletter, I focused on Vaccines Q&A, but the School Aged Surveillance Data report came out that day too. Most trends are going down for children, however this graph stood out. It shows the number of clusters of COVID-19 associated with schools and daycare centers. There’s a substantial delay on this, due to the incubation time of the virus and the time it takes to connect the dots during contact trace investigation to link a cluster of illnesses to the school setting. So it looks like the surge happens later on this graph than we saw with cases, but I think that’s an artifact of the issues I outlined above. In any case, seeing that there were >50 outbreaks associated with a school setting in a single week is kind of a big deal. It would also seem to contradict the idea that transmission doesn’t happen in schools. I’ve discussed safe school reopening before. I think it can be done safely, however it requires a strong safety culture both inside and outside of the building to include community commitment to bringing disease transmission to low levels. Unfortunately, the commitment to safety culture has been a hard thing to accomplish. People are tired and leaders don’t want to be the “bad guy.”

Hospitalizations: There were 24 new hospital admissions for COVID-19 today and 2 admissions to the ICU. We typically see lower numbers on Mondays.
According to the HHS Community Profile Report, the Georgia counties with the highest COVID-19 admission rate per 100 beds are Evans, Peach, Screven, Grady and Pulaski.

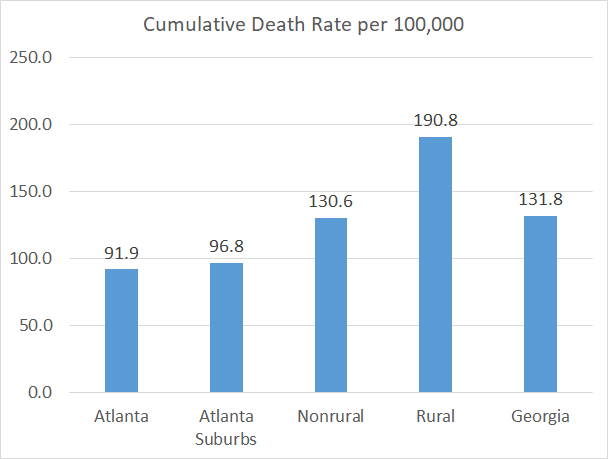
Deaths: there were 33 newly reported confirmed deaths compared to yesterday’s total and 24 probable deaths. Death reporting on Mondays is typically low due to weekend effect. For today’s deaths, 33.3% came from nonrural counties and 30% each came from rural counties. The state 7-day death rate per 100,000 residents is 9% higher than the summer peak. The death rate since the start of the pandemic is highest in rural counties and lowest in the Atlanta counties. Unfortunately, the disparity is widening with every surge.
I’ll leave you today with a picture I took today on the way to the grocery store. This is the Missouri River that separates Kansas and Missouri. Those are icebergs in the water. It’s not expected to get above 0F today and the wind chill is -22F. Be safe and be warm!


References
https://covid.cdc.gov/covid-data-tracker/#vaccinations
https://beta.healthdata.gov/download/gqxm-d9w9/application%2Fpdf
https://dph.georgia.gov/covid-19-daily-status-report
https://covid-gagio.hub.arcgis.com/
https://www.nytimes.com/interactive/2020/us/covid-19-vaccine-doses.html
https://beta.healthdata.gov/api/views/gqxm-d9w9/files/a88ef766-5ec2-476b-8de1-127b73278137?download=true&filename=Community_Profile_Report_20210206_Public.xlsx
https://beta.healthdata.gov/api/views/gqxm-d9w9/files/38bef593-0311-4f9b-8dee-a3ec3a8d1b81?download=true&filename=Community_Profile_Report_20210206_Public.pdf
Georgia COVID-19 Updates is a free newsletter that depends on reader support. If you wish to subscribe please click the link below. There are free and paid options available.
My Ph.D. is in Medical Microbiology and Immunology. I've worked at places like Creighton University, the Centers for Disease Control & Prevention and Mercer University School of Medicine. All thoughts are my professional opinion and should not be considered medical advice.