

The Daily Digest, 12Apr2021
Georgia COVID-19 Updates

Vaccine Update
The data provided in the table below are publicly available and current as of the CDC update at 6:17 pm on 11Apr2021. The table compares Georgia’s data to the US average. CDC indicates that 7,197,345 doses have been delivered in the state of Georgia and 4,667,495 have been administered in the state of Georgia. That leaves an inventory of 2,529,850 doses on hand. That’s enough vaccine to dose 23.8% of the total Georgia population.
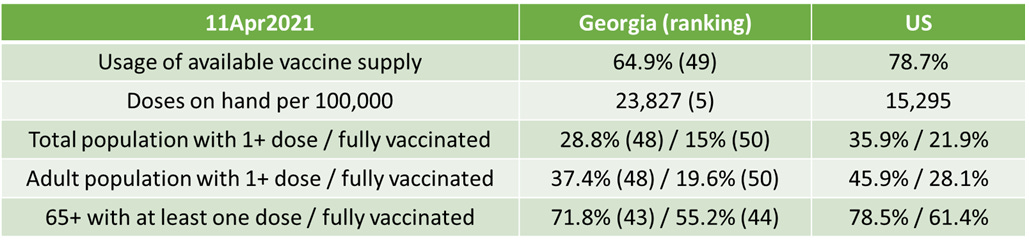
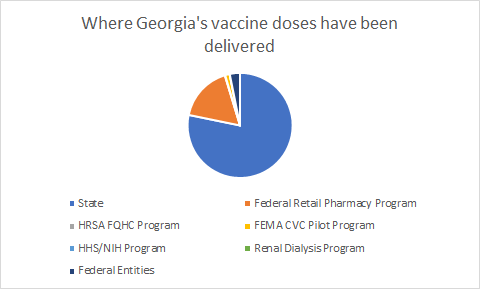
Last week I talked about a new data resource that helps us to see where the doses delivered to Georgia have gone, according to the federal government. It’s important to remember that the federal government is the sole gatekeeper on vaccine allocations to the US states and territories. So they have the complete data set of where the doses went. As of the last update on 01Apr2021, 78% of the doses went to the state, 17% went to the federal retail pharmacy program, and 3% went to federal entities (i.e. Department of Defense, Department of Corrections, Veterans Affairs, etc).
One thing that’s really frustrating is that the states with the lowest rates of 1+ doses administered as a percentage of the total population are all southern states. The bottom five states are Mississippi (ranked 50), Alabama, Georgia, Louisiana and Tennessee. This is probably due to a combination of things including poor funding for public health for the past decade, attitudes on the seriousness of the pandemic and the need for vaccination, and how accessible the existing healthcare infrastructure is for the state’s citizens. Communities that are historically under-served are at higher risk for vaccination disparities. CDC tells us that county of residence data is only available for about 50% of vaccine recipients in Georgia. So the new and improved DPH vaccine dashboard, as pretty as it is, is only able to show us about half of the data. When we have imperfect data like this, we have to use proxy data to identify areas of need. One proxy method I like is this one below by Surgo Ventures, combining what we know about pre-pandemic challenges (left side of the graphic in the banner).

Using their method, we can see that the South and the West are going to be areas of significant challenge when it comes to vaccinating their populations for COVID-19. In fact, their COVID-19 Vaccine Index predicted that Georgia would be the #5 state of concern with respect to challenges in COVID-19 vaccination efforts.
We may be getting to a point soon where vaccination rates will plateau because the strategy of expecting the public to come to centralized vaccination sites will have served everyone interested in vaccination who can access those sites. That means there has to be a pivot to more community-outreach based vaccinations.

These community outreach vaccination efforts are less efficient than mass vaccination sites. As a consequence, they take more time and money to perform. I think there’s a tendency to assume that the plateau will be due to vaccine hesitancy. And that is certainly part of it. But I don’t think that’s the majority of the problem. I worry that the hesitancy concern, whether a true barometer of success or not, will be used as an excuse to under fund or not perform community-oriented vaccination strategies. Sort of, “we’ve vaccinated everyone who wants one and we’re done here.” When in reality, there are a lot of people who have been historically underserved by the medical community and continue to be underserved in the pandemic. Ignoring this reality will prolong the pandemic, harm additional people, and delay post-pandemic recovery (economic and otherwise) for the state. I worry about this because the state has been unwilling to dedicate a lot of state funds to public health, even after the problems exposed by the pandemic.
That’s why it’s pretty important that CDC is granting $96 million to the state of Georgia to fund community-oriented vaccination efforts specifically to help underserved communities in the state. In this way, it doesn’t matter whether public health and serving the medically underserved are priorities to the state. They are priorities to the federal government. Of the $96M, 75% is required to focus on improving vaccine uptake by medically underserved populations. And 60% of the funds are to be given to local health departments, community organizations and community health centers, bypassing the state administration all together. Knowing that community-oriented vaccine outreach and administration is time consuming and costly, these funds from the federal government ensure money can’t be a reason not to do so now.
Again, Georgia has enough vaccine in the freezers across the state to dose about 24% of the Georgia population right now. That’s one in four residents. We don’t have to be last or nearly in the country. The state has no shortage of vaccine supply with 2.5 million doses on hand, but the state does have challenges when it comes to making vaccine available for its residents. We should be asking questions and putting pressure on the state government to explain where those doses are located, why they’re being held, and what the plan is to speed up vaccine administration.
The World
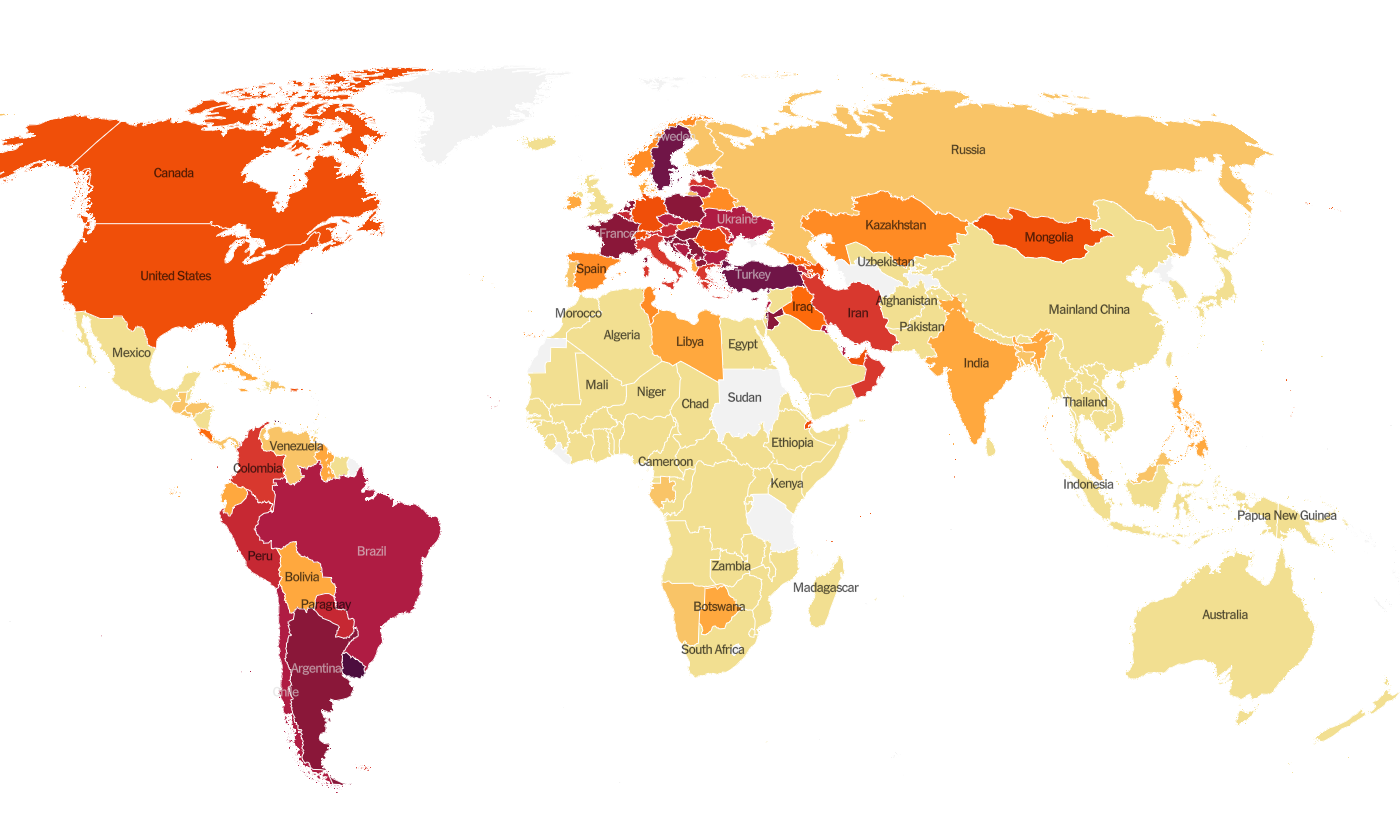
According to the New York Times Coronavirus Tracker, the SARS-CoV-2 virus that causes COVID-19 disease has sickened >136.1 million people (+4.8 million since last week) and killed at least 2,853,000 (+84,000 in the past week) worldwide as of this morning. For both cases and deaths, the increases this week are greater than the increases during the previous week and this trend has continued for at least 3 weeks now. So it seems that things are growing more intense. Intensity is growing for Canada and the US, most of South America, Europe, the Middle East and Mongolia.
The US is ranked #56 in the world for average daily case rate per 100,000 people over the past 7 days (last week. #54) with a rate of 21 (last week, 19). The top five countries for average daily case rate per 100,000 in the past week are Curacao, Uruguay, Bermuda, San Marino and Bahrain.
For deaths, the US average daily death rate per 100,000 over the past week is 0.22 (previous week was 0.25), and we are ranked #60 in the world for this (last week we were ranked #49). So the US death rate decreased this week while it intensified for other parts of the world. The top five countries for average daily death rate per 100,000 in the most recent week are Hungary, Bosnia and Herzegovina, North Macedonia, Curacao, and Bulgaria.
The United States
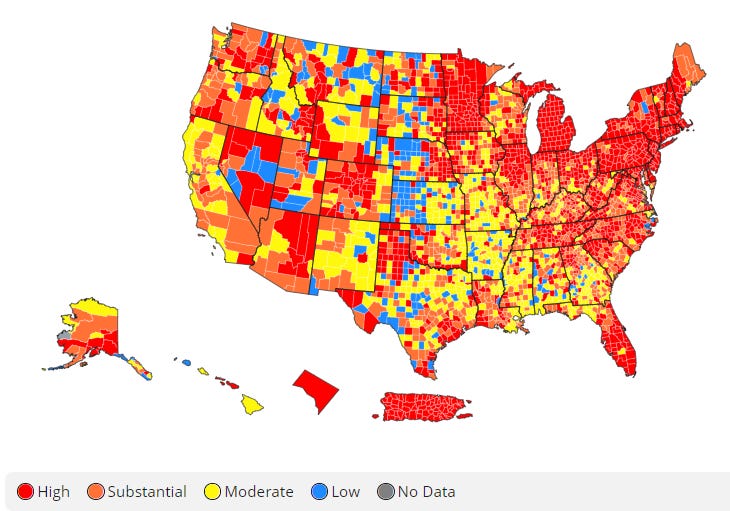
The map above comes from the CDC COVID-19 Tracker on the Community tab, county view. The map above looks at the combined community transmission indicators that looks at both case rate and test positivity. Red and orange are considered the danger zone, yellow is safer and blue is safest. This week the intensity observed in Minnesota and Michigan has started to crowd into Wisconsin. The panhandle of Texas is also growing more intense.
As of this morning, the New York Times coronavirus tracker indicates there have been over 31.2 million cases (+500,000 in the past week) and 561,527 deaths in the US (+6948 in past week).
According to data from the 11Apr2021 HHS Community Profile Report (the source document for the White House Coronavirus Task Force reports), the top five states in the nation for new case rate per 100,000 residents are Michigan, New Jersey, New York, Minnesota and Pennsylvania. The top five states in the nation for new death rate per 100,000 in the past 7 days are Montana, West Virginia, New Jersey, New York and Georgia.
The table below tells you where we are this week and how that compares to the previous week (in parentheses). The data for everything comes from the HHS Community Profile Report from 11Apr2021.
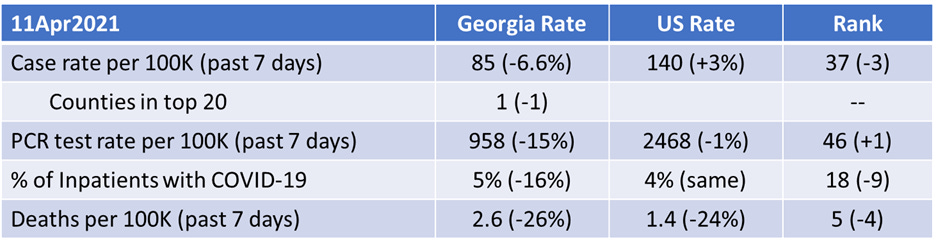
Georgia has just one county in the top 20 counties in the US for new case rate, Chattahoochee county at #1. The remaining counties in the top 20 are all in Michigan or Texas.
Georgia
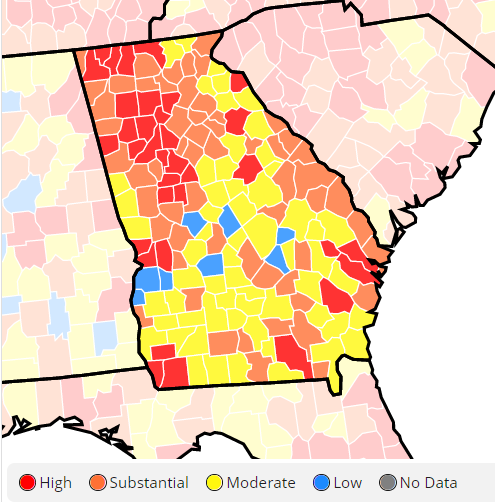
We can zoom in on a current view of Georgia using the CDC community transmission criteria. Last week, there were 5 counties in the blue category and 44 counties in the yellow category, with 69% of Georgia’s counties in the substantial or high transmission categories. This week, there are 8 blue counties and 59 counties in the yellow category. That leaves 58% of the state’s counties in the substantial or high transmission categories. So on a county to county level, disease transmission got much better this week.
Let’s discuss today’s numbers for Georgia.
Testing: a low day for PCR testing and an average day for antigen testing. For PCR testing, there were 11,007 new PCR results reported, 6% of which were positive. There were 7,270 new antigen tests reported today and 6.9% were positive.
Cases: cases are often lower on Mondays due to weekend effect. But today’s numbers are 46% higher than last Monday. Today there was a net increase of 939 newly reported cases (583 by PCR, 356 by antigen test). The 7-day case rate remains 19% above the pre-winter surge baseline.
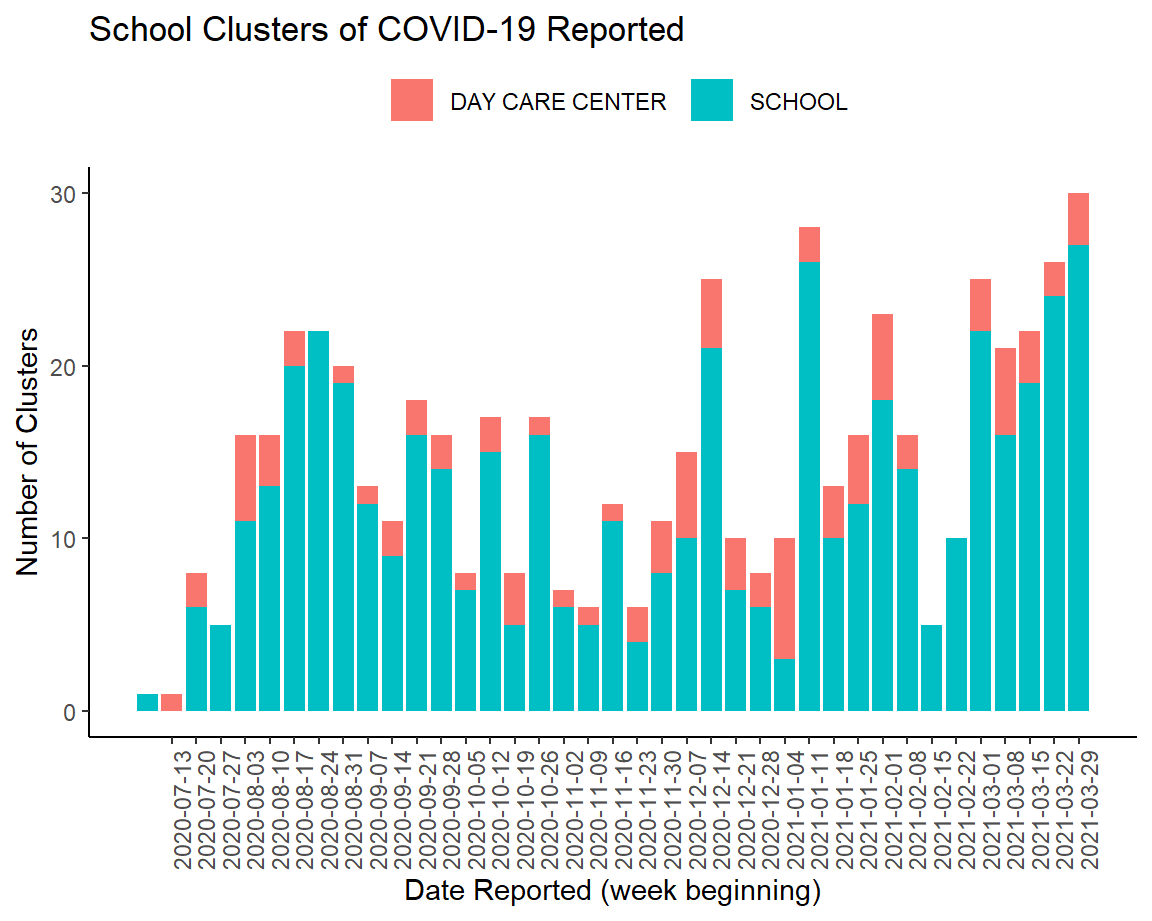
For the second week in a row, the School Aged Surveillance Data Report from DPH shows that the number of disease clusters associated with schools and daycares is rising.

Hospitalizations: Usually we see small numbers for the weekend that show up on Sunday and Monday, but this week they are high. There were 65 new hospital admissions for COVID-19 today (last week, 9) and 2 admissions to the ICU.
According to the HHS Community Profile Report, the Georgia counties with the highest percentage of COVID-19 patients are Paulding, Douglas, Newton, Henry and Whitfield counties.
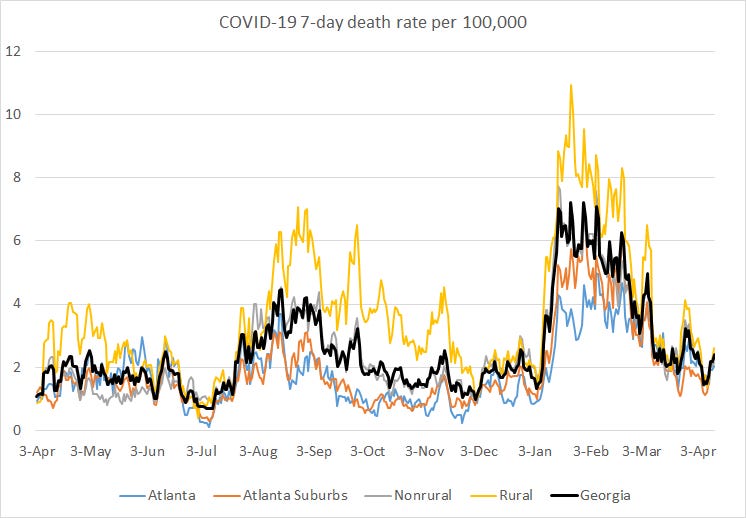
Deaths: there were 35 newly reported confirmed deaths compared to yesterday’s total and 0 probable deaths. Death reporting on Mondays is typically low due to weekend effect. The state 7-day death rate per 100,000 residents is 58% above the pre-winter surge baseline.

References
https://covid.cdc.gov/covid-data-tracker/#vaccinations
https://dph.georgia.gov/covid-19-daily-status-report
https://covid-gagio.hub.arcgis.com/
https://www.nytimes.com/interactive/2020/us/coronavirus-us-cases.html
https://covid.cdc.gov/covid-data-tracker/#county-view
https://dph.georgia.gov/school-aged-covid-19-surveillance-data
https://www.cdc.gov/coronavirus/2019-ncov/vaccines/distributing/jurisdiction-portfolios.html
https://surgoventures.org/resource-library/the-us-covid-19-vaccine-coverage-index-leaving-no-community-behind-in-the-covid-19-vaccine-rollout
https://www.ajc.com/news/coronavirus/amid-deadly-pandemic-georgia-not-increasing-public-health-spending/GJFLXJVKCZD6ZC4O4Z4XOSPEGQ/
https://www.ajc.com/news/coronavirus/georgia-awarded-nearly-96-million-to-expand-vaccine-programs/DJOP5DP4E5GW7MJES73IDVGWLQ/
Georgia COVID-19 Updates is a free newsletter that depends on reader support. If you wish to subscribe please click the link below. There are free and paid options available.
My Ph.D. is in Medical Microbiology and Immunology. I've worked at places like Creighton University, the Centers for Disease Control & Prevention and Mercer University School of Medicine. All thoughts are my professional opinion and should not be considered medical advice.
Dr. Schmidtke, I've been following your newsletter since the middle of last year. I appreciated all your hard work in keeping us informed. I've been observing the numbers here in the Atlanta metro area as well as our state. The one thing that stands out in your 4/12 report is the same thing that I've been noticed in other parts of the nation, the highly vaccinated areas seems to collate with an increase in covid cases over the last 4-6 weeks. For instance, the state of MI has a high vaccination rate as well as a high increase in hospitalization. In your newsletter the maps of GA seems to show the counties that have the lower vaccination rates all so seem to have lower covid cases (blue and yellow). During 2020 the cases in the Atl. metro area, seemed to have fared better than those in central and southern GA. But now that we have higher vaccination rates, we also seem to have an increase in cases compared to the rest of the state. Could you please comment.