
Hello! For those who are new to the newsletter, I typically take Saturdays off unless something really big happens with the COVID-19 data. I’ll be back on Sunday with a week-in-review analysis. So don’t panic when you don’t get an email tomorrow.
Testing
Today there were 26,926 new PCR (diagnostic) tests reported. Of those, 3557 were positive, yielding a percent positive rate of 13.2% for the day. You can see how our percent positive rate has changed over time below.

This metric is useful for determining whether we are doing enough testing. The World Health Organization guidance is that we need to achieve 5% or less for positivity rate to ensure we are doing enough testing to contain the virus. We have been struggling with that goal for a while, even with expanded testing.
Cases
Above, I mentioned that the number of PCR positives today was 3557. However that is just the positive test results submitted to Georgia Department of Public Health (DPH) through electronic laboratory reporting (ELR). They receive additional submissions through phone, email, fax, etc, but these sources often don’t provide total tests, only positives. So they can’t really be used to calculate the percent positive rate above. The total new cases reported today was a record, 4484. The new statewide total is 111,211.
Below you can see how today’s new cases compare to new case reports over time. Of note, I had to adjust my y-axis today to accommodate the new cases, telling you just how big this change is. The red dashed line is the 7-day moving average that helps us to see the trend through the noise.

Nonrural counties led the way with 1669 new cases. Rural and Atlanta suburb counties were nearly equivalent with 1081 and 1066 cases respectively. Atlanta had 936 new cases today. It wasn’t long ago that any one of those totals was our total for the entire state for a given day. Below I’ve brought back a graph I haven’t shown in a while, that looks at how cases have accumulated over time for each county type.
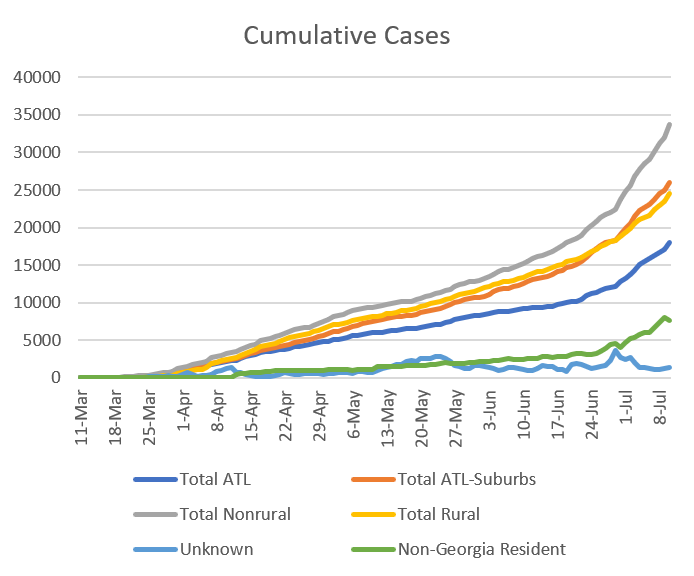
Nonrural counties have always contributed the largest number of cases, but they have really tilted upward with their accumulation of cases in the last two weeks. Things have turned upward for all county types, however, and now Atlanta suburbs have overtaken all of rural Georgia.
Below you can see how cases have increased over the past 7 days for each of Georgia’s 159 counties.

Right now things are hottest in central Georgia but things remain intense along the coast.
Yesterday’s counties of concern list had 15 counties on it. Today that has tripled to 44, or about 28% of Georgia’s counties. I make this list based on a county having both a >25% 7-day increase and a >5% 24 hour increase. However, I allow a grace period for counties that were on the list yesterday but may have had a low testing day and dipped below 5% for the 24 hour increase. Those counties are shaded in tan.

If you look at the DPH case curve, it looks like we’ve possibly entered into exponential growth of cases. If you remember learning exponents and graphing in high school, you’ll remember that is when the line goes very steep, very fast. The problem with exponential growth in the context of disease spread is that everything looks like okay until it is very much not okay. We saw that in New York City during their peak this spring. Exponential growth is something I think every person I know in public health is afraid of.
Hospitalizations
Today there were 331 new hospitalizations reported compared to yesterday. Those currently hospitalized increased to 2443. As has been the case for the past 11 days, this is a new record since Georgia Emergency Management Agency (GEMA) began providing these details to the public.

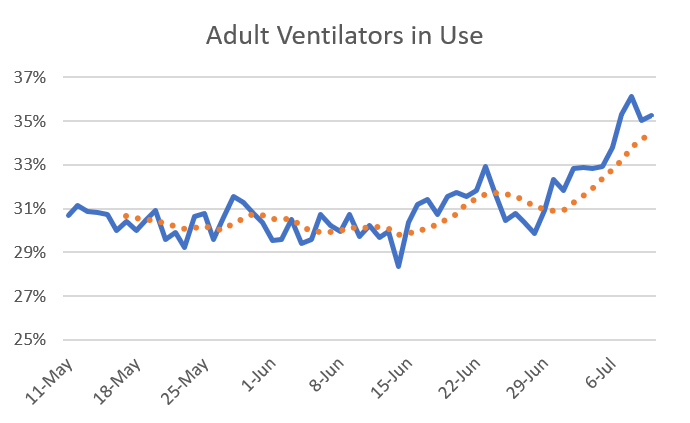
Here’s how adult ventilator usage has trended since GEMA began providing these data. The red dashed line is the 7-day moving average. For weeks, the usage has hovered around 30% but we have seen a steady increase over the past two weeks. At present, GEMA does not provide details on pediatric ventilator availability.
Hospitals in the Atlanta metro are reporting that their ICUs are full. We don’t know how many of those are COVID-19 patients in most cases, but this should worry everyone. Understand that the healthcare workers who staff these beds are specialists , and difficult to replace if they get sick. I really think the public needs to appreciate this, because infections among healthcare workers are not uncommon. When they are infected, they likely have to self-quarantine for at least 14 days. They’re out of the ICU if that happens and the entire staff gets strained with their absence. So it’s not just beds that we need to worry about but also staffing. So please, I implore you to take this seriously and treat the trends over the past week as an emergency. These strains combined with what might be the beginning of exponential growth mean we could potentially overwhelm our healthcare infrastructure just like we saw take place in New York City.
Deaths
There were 35 new deaths reported today, a medium day for us and this is the highest we’ve had since 25Jun. A note, not all of these people died today, but we found out about their death today. Just like the case curve on the DPH update, the deaths are backdated to the date of death. So there is a 14-day window of uncertainty with unreliable data that really can’t be trusted until we have more time for reports to come in. The new statewide total is 2965. Thirteen of today’s deaths came from rural counties, 10 came from nonrural counties, 9 came from the Atlanta suburbs and 4 came from Atlanta.
Below you can see the death curve from DPH that I talked about above. I’ve marked two things for you. First is the date that Georgia reopened on 24Apr. The second is the area close to the 14-day window of uncertainty that shows a slight increase. This could be noise, it’s too early to tell. But I am nervous that this is the beginning of an increase in deaths at a particularly bad time. If hospitals get overwhelmed, it will intensify the increase of this curve.

I’ll sign off with something I’ve said before on the newsletter: the things we do (or don’t do) today will have an impact on cases 2 weeks from now and on hospitalizations and deaths 3-4 weeks from now. We are on a trajectory right now that this also means that no matter what changes we implement today, we are on a path of increase that can’t be stopped for at least 3-4 weeks. So brace for more hard days that set records. But also do whatever you can to minimize your exposures so that we can shorten how long this intense increase continues. Be safe and be well! See you on Sunday!
Media
Rural America has its own coronavirus problem: https://megaphone.link/AXIOS3054592992
Georgia COVID-19 hospitalizations surge, breaking new records: https://www.fox5atlanta.com/news/georgia-covid-19-hospitalizations-surge-breaking-new-records
References
https://dph.georgia.gov/covid-19-daily-status-report
https://gema.georgia.gov/document/document/7-10-20georgiasituationreportcovidpdf/download
Hi Amber, m genuinely curious if there is any data on people hospitalized for COVID symptoms versus those who test positive after being admitted for something else.
Thank you for all the information you for giving out. I have one question to further my knowledge. In each post on testing, you are referring to positive PVR testing and not Antibody, correct?