Vaccine Update
We can see how the US (and Georgia) is doing with respect to the vaccine administration effort using the CDC’s COVID-19 Data Tracker understanding that delayed reporting can affect the numbers. Nationally, 69% of the available doses have been administered, either as a first or second dose. And Georgia’s usage rate is just behind the national rate, 67.9%. While we wait for supply to increase, it is vital that we make the most use of the vaccine we *do* have. So, of course, I would prefer to see that percent administered be much, much higher. Hopefully the remaining doses have an appointment to meet their recipient in the coming days. Of those who have started the vaccine series, 29% have had their second dose.
Georgia’s vaccination rate has increased 43.6% in the past week, which is good news but not as good as the previous week. 210,237 people have completed the 2-dose series in Georgia (1.98% of the GA population). It is great to see that upward momentum. Georgia lost some ground this week, moving down from #28 to #38 in the nation this week, with a 1+ dose vaccination rate that is 8591 per 100,000 residents. The top three states for first doses administered per 100,000 residents are Alaska (14532), West Virginia (12143), and New Mexico (11700). The bottom three states are Iowa (7529), Alabama (7660), and Missouri (7779). This week, Georgia has administered 1+ doses per 100,000 at a rate that is 41% less than the leader (Alaska). But last week the difference was 44% higher. So we’re continuing to narrow that gap and improve.
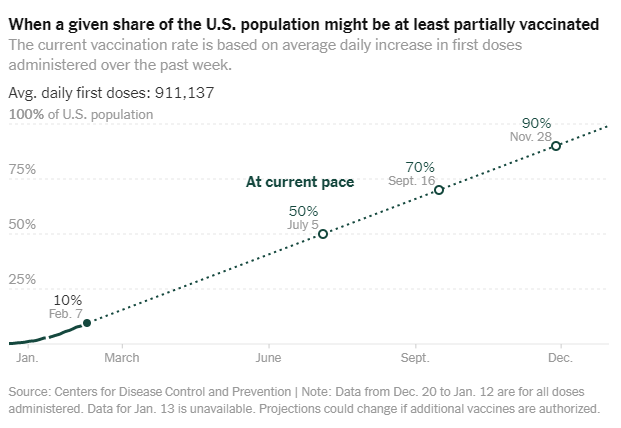
It’s estimated that we need to vaccinate 70-90% of the population before we achieve herd immunity. The New York Times has a vaccines by state tracker and part of it includes a projection of when we might have 70-90% of the population at least partially vaccinated, given our current pace. Nationally, the estimate is that we would reach 70% by September 16 and 90% by November 28th. We should note that immunity isn’t achieved until two doses of the currently available vaccines are administered. And another thing to note is that this may accelerate as additional supply of vaccine is generated, either due to mass production or authorization of additional vaccines.
I think that while this graph is daunting, it frames the vaccine effort in a new way - this is the race back to “normal.” So whereas Georgia has administered 2 doses to 1.98% of its population (#46 in the US), West Virginia (#1) has done so for 5.8% of its population. The states that win this race will have faster economic recovery as well as saving countless lives along the way. So we really should be throwing everything we have behind this effort.
The World
According to the New York Times Coronavirus Tracker, the SARS-CoV-2 virus that causes COVID-19 disease has sickened >106.2 million people (+3.3 million since last week) and killed at least 2,317,400 (+90,700 in the past week) worldwide as of this morning.
Things have improved this week for many countries in terms of average daily cases per 100,000, including the countries where more transmissible variants of the virus have emerged - the UK, Brazil and South Africa. Things have intensified for Spain and Portugal. We are ranked #19 in the world for average daily case rate per 100,000 people over the past 7 days (last week #13) with a rate of 36 compared to 45 last week. So our case rate has improved. The top five countries for average daily case rate per 100,000 in the past week are Montenegro, Israel, Turks and Caicos Islands, Czech Republic and Portugal.
For deaths, the US average daily death rate per 100,000 over the past week is 0.85 (previous week was 0.95), and we are ranked #13 in the world for this (last week we were ranked #12). The top five countries for average daily death rate per 100,000 in the most recent week are Gibraltar, Portugal, Monaco, Slovakia and the United Kingdom.
The United States
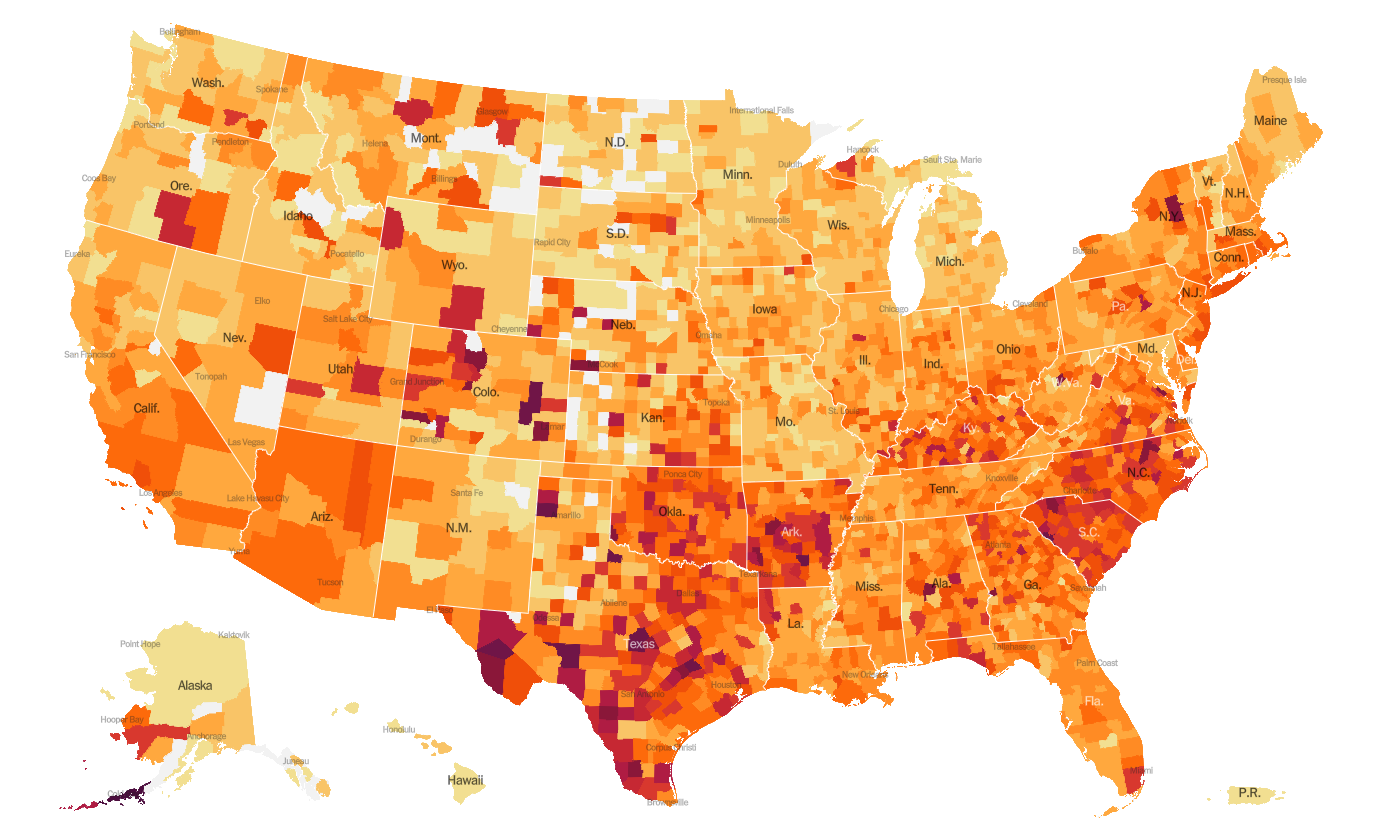
The map above comes from the New York Times Coronavirus Tracker. As of this morning, there have been over 27 million cases (+800,000 in the past week) and 463,338 deaths in the US (+22,042 in past week). Keep in mind that both of these numbers are probably an under-count of the situation in our country.
This week things are a lot better for many areas, including Georgia, Arizona and California. Intensity remains high for the Carolinas, Arkansas and Texas. According to data from the 31Jan21 HHS Community Profile Report (the source document for the White House Coronavirus Task Force reports), the top five states in the nation for new case rate per 100,000 residents are South Carolina, Texas, Arkansas, North Carolina and Arizona. Georgia is ranked #10. The top five states in the nation for new death rate in the past 7 days are California, Texas, Indiana, New York and Florida. In addition to Florida (#5), other Southern states in the top 10 include Tennessee (#6), Alabama (#8) and Georgia (#9).
The table below tells you where we are this week and how that compares to the previous week (in parentheses). The data for everything comes from the HHS Community Profile Report from 06Feb2021.
Georgia is steady for rankings in test rate and the percent of hospitalized inpatients who are being treated for COVID-19. We dropped one rank for new case rate and new death rate per 100,000 this week. It’s good news, but I think we’d all prefer to be out of the top 10.
Influenza-like illness in all of the US remains minimal. During the 2020 - 2021 influenza season to date there has only been one pediatric influenza death compared to 195 the previous year. You can consult FluView any time you’d like to see their data visualizations. You can read the weekly report from Georgia Department of Public Health here.
I’d like to take a moment to look at testing rates by population. These data come from the 06Feb2021 HHS Community Profile Report (the PDF executive summary document). The top graph shows the percent positivity for testing by age group over time. The national average (for all age groups) is shown in the dashed line. The test positivity rate is lowest for 18-24 year olds, approximately 5% - a good thing! Test positivity is highest for children, especially 12-17 year olds. That means that we are most likely to be missing pediatric cases, more so than other age groups. Those disparities make sense when you look at the bottom graph.
A good explanation for why the test positivity rate is highest for children is because we’re testing them at far lower rates than any other age group. For 12-17 year olds, it looks like we’re testing at a rate that is about 4x less than 18-24 year olds. It’s hard to find disease when you’re not looking for it.
Georgia
I’m sharing the map that’s formatted the same way as the Brown University School of Public Health tool but includes Georgia’s antigen cases. There hasn’t been much point in sharing it in recent weeks because the entire state was labeled red (the highest risk category. This week there are 137 counties in the red category, 20 in the orange category and 2 in the yellow category. You can click on the map below to see the live image that allows you to click/hover over your county.
Let’s discuss today’s numbers for Georgia.
Testing: a lower day for PCR testing, not unusual considering it is a Monday. There were 23,176 new PCR results reported, 13.3% of which were positive. Antigen testing identified 8% of today’s cases.
Cases: cases are often lower on Mondays due to weekend effect. Today there was a net increase of 2704 newly reported cases (2488 by PCR, 216 by antigen test). We haven’t seen a daily case total this low since 06Dec. Of today’s newly reported cases, 38% came from Atlanta suburb counties and the next highest county type was nonrural counties outside of the Atlanta metro (27.5%).
Hospitalizations: I don’t get the impression that the Georgia dashboards for patient census and hospital capacity are fully back to normal, since they didn’t update at midnight last night. They did update this afternoon, however. As a result, I’m going to begin tracking both the number reported by Georgia and the US Department of Health and Human Services. Hospitals report to both. According to the state of Georgia, there are 3421 patients currently hospitalized for COVID-19. According to the HHS, the number is 3945 and that’s a pretty big difference (524 patients). A small portion of this difference may be explained by HHS counting pediatric hospitalizations (n = 59). The other piece of inside info I can offer is that there is no one really assigned to curating the dashboards since the state’s COVID-19 data task force was stood down in August. So when errors are found, there isn’t really motivation or bandwidth for someone to double check them. So I may start to favor the HHS data, because I’m not as trusting of the data quality at the state and especially since HHS offers more data than the state. There is also an important difference when it comes to ICU utilization. According to the state, 83% of the state’s ICU beds are in use, whereas according to HHS the number is 89.4%. Thirty seven percent of the state’s ICU beds are being used by COVID-19 patients. According to the HHS Community Profile Report (06Feb2021), the top 5 counties for percentage of inpatient beds occupied by a COVID-19 patient are Dodge, Bacon, Douglas, Wilkes and Crisp counties.
There were 86 new hospital admissions for COVID-19 today and 3 admissions to the ICU. We typically see lower numbers on Mondays.
Deaths: there were 35 newly reported confirmed deaths compared to yesterday’s total and 3 probable deaths. Death reporting on Mondays is typically low due to weekend effect. For today’s deaths, 28.6% came from rural counties and 26% each came from Atlanta suburb and nonrural counties outside of the Atlanta metro. The state 7-day death rate per 100,000 residents is 24.7% higher than the summer peak.
References
https://covid.cdc.gov/covid-data-tracker/#vaccinations
https://beta.healthdata.gov/download/gqxm-d9w9/application%2Fpdf
https://dph.georgia.gov/covid-19-daily-status-report
https://covid-gagio.hub.arcgis.com/
https://www.nytimes.com/interactive/2020/us/covid-19-vaccine-doses.html
https://beta.healthdata.gov/api/views/gqxm-d9w9/files/a88ef766-5ec2-476b-8de1-127b73278137?download=true&filename=Community_Profile_Report_20210206_Public.xlsx
https://beta.healthdata.gov/api/views/gqxm-d9w9/files/38bef593-0311-4f9b-8dee-a3ec3a8d1b81?download=true&filename=Community_Profile_Report_20210206_Public.pdf
Georgia COVID-19 Updates is a free newsletter that depends on reader support. If you wish to subscribe please click the link below. There are free and paid options available.
My Ph.D. is in Medical Microbiology and Immunology. I've worked at places like Creighton University, the Centers for Disease Control & Prevention and Mercer University School of Medicine. All thoughts are my professional opinion and should not be considered medical advice.


