The Daily Digest, 02Jul2020
Georgia COVID-19 Updates

Testing
It was a big day for tests and that’s a really good thing. It was also a really big day for cases (more on that in a moment) and this increase in testing may contribute to the case total.

However, looking at total tests performed is interesting but are we doing enough testing to accomplish our goal of containing this virus and getting back to normal life? Based on our percent positive rate each day and comparing that to World Health Organization guidance that we stay under a 5% positivity rate, we aren’t there yet, even on one of our best days of testing.
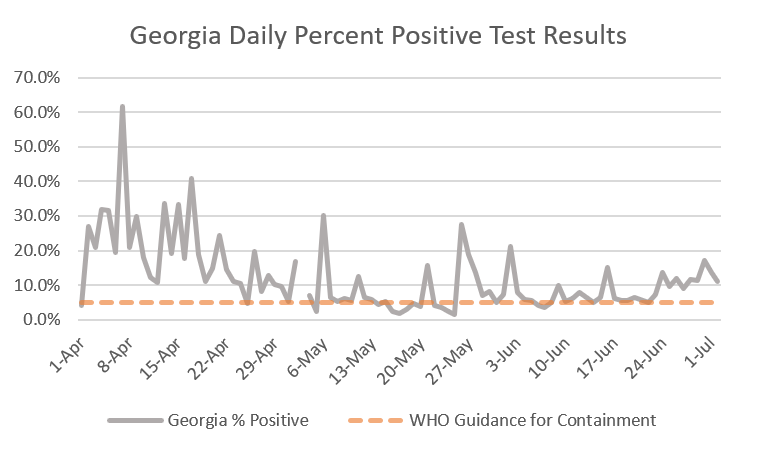
You can read more about the significance of 5% and why it matters here. Some argue that we need to be as low as 3% based on the successful strategies used in other countries.
Cases
I suppose we need to get used to the idea that every day we are going to set a new record for daily case reports. Today there were 3472 new cases, 526 more than the record we set yesterday. Below you can see how new case reports have varied over time. The red dashed line is the 7-day moving average that helps us to see the trend. You can read more about why a 7-day moving average is useful by visiting my colleague’s blog post here.

Here’s where the new cases came from:
Nonrural counties (not part of the Atlanta metro): 25.6%
Atlanta suburbs: 20.3%
Non-Georgia residents: 16.9%
Atlanta counties: 13.3%
Rural counties: 13.2%
Unknown: 10.6%
The unknown category is a holding zone that ebbs and flows as contact tracers conduct their investigations and follow up. The non-Georgia resident thing is interesting - this would include people like migrant workers, immigrant detainees, prisoners, those living on a military installation, VA nursing home residents, etc. We don’t get any details on the breakdown within this category. But several of the counties of concern (further down in the newsletter) either host or neighbor military bases. Lumping all of these disparate groups together and away from their region in the state makes it hard to assess the real disease burden in a given county. In other words, things may be worse in some of these counties than we currently realize.
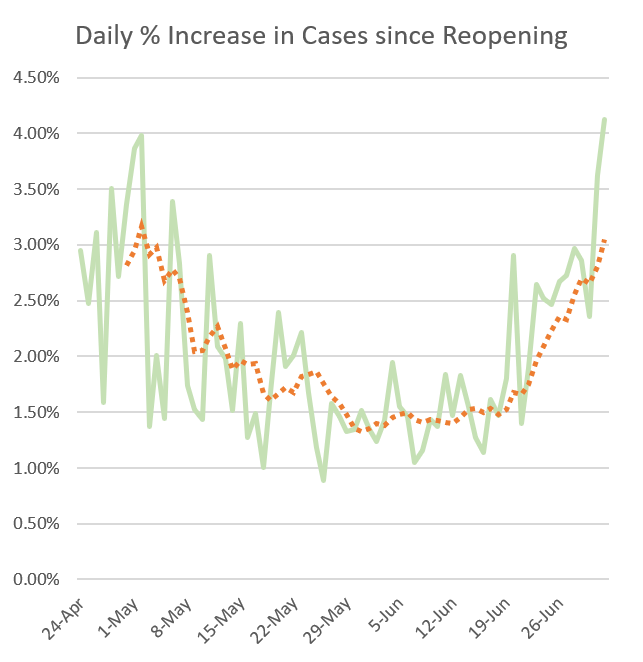
Another way to look at the case increases is as a percent increase over the previous day’s total. I noticed something interesting, but perhaps predictable, today when looking at how things have progressed since the state’s reopening on 24April. I should mention that as our total case count has gotten larger, a day’s increase can get diluted because the denominator is so large now. The fact that we see such large increases recently in this graph reinforces just how large our cases have been in the past couple weeks. The orange line is the 7-day moving average to better allow us to see the trend.
These are the counties of concern when you consider a 24 hour increase of >5% and a 7-day increase of >25%. Counties in tan have been on the list previously but had a lower 24-hr increase today. They will drop off tomorrow if that continues. I’ve also highlighted counties in red that have a >50% increase in the past 7 days.

There are 30 counties on this list, of 18.9% of the state’s counties. Many of them are along the Georgia coast but cases are intensifying in other areas too, including Central Georgia with Jones county showing a big increase. Bibb and Houston counties are heating up too.
Today I was asked to estimate what we think the worst case scenario is for this in terms of what our total case count will be. My answer was “how high can you count?” Because currently we are not doing anything to slow this down. From a public health perspective, we need to halt reopening, reverse it and probably go back to some version of a shelter in place if we want to blunt what is coming.
Hospitalizations
There was a 5.4% increase in current hospitalizations overnight for COVID-19 and today’s total stands at 1649. These increases show us that we aren’t just identifying asymptomatic or mild cases of COVID-19. Testing is identifying people who need advanced care.

Deaths
There were 22 deaths reported today, the same number as yesterday. 11 came from rural counties, 10 came from nonrural counties that aren’t considered Atlanta metro. There was one death in the Atlanta suburbs. The new statewide total is 2849.
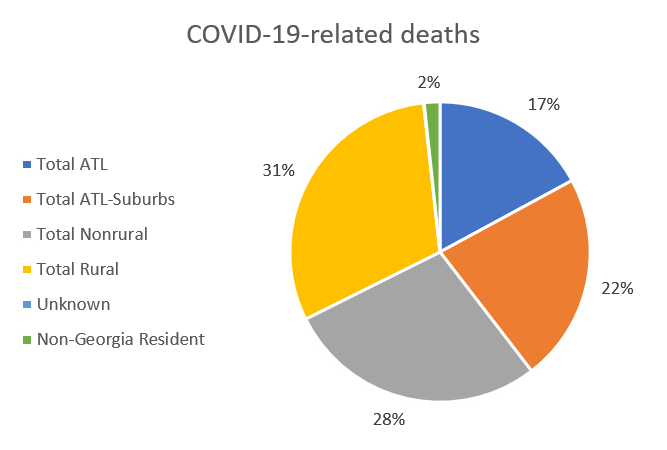
To date, here’s how the deaths have been distributed.
References
https://dph.georgia.gov/covid-19-daily-status-report
https://gema.georgia.gov/document/document/sitrep-72/download
https://www.georgiaruralhealth.org/blog/what-is-a-moving-average-and-why-is-it-useful/
https://globalepidemics.org/2020/05/29/evidence-roundup-why-positive-test-rates-need-to-fall-below-3/
https://coronavirus.jhu.edu/testing/testing-positivity