

The COVID Digest, 29Jan2022
Attitudes regarding COVID-19

Happy Saturday! We’ve made it through another week of the pandemic.
Today’s newsletter will feature the following topics:
A look at the recent trends: national, Georgia, Kansas City
Polling data on attitudes regarding the pandemic in Georgia
National Picture
The images below come from the Department of Health and Human Services Community Profile Report, dated 27Jan2022. The graph on the top shows new case rate per 100,000 by region. We can see that for the northeast, the Omicron wave is waning and they currently sit at a rate that is four times higher than their case rate prior to the surge. It’s hard to make out, but the midwest and the south overlap with the national line, descending like the northeast, but not at the same rate. In the west (orange) they are possibly peaking but it looks like a plateau. So we’ll need to keep an eye on this to see where it goes.
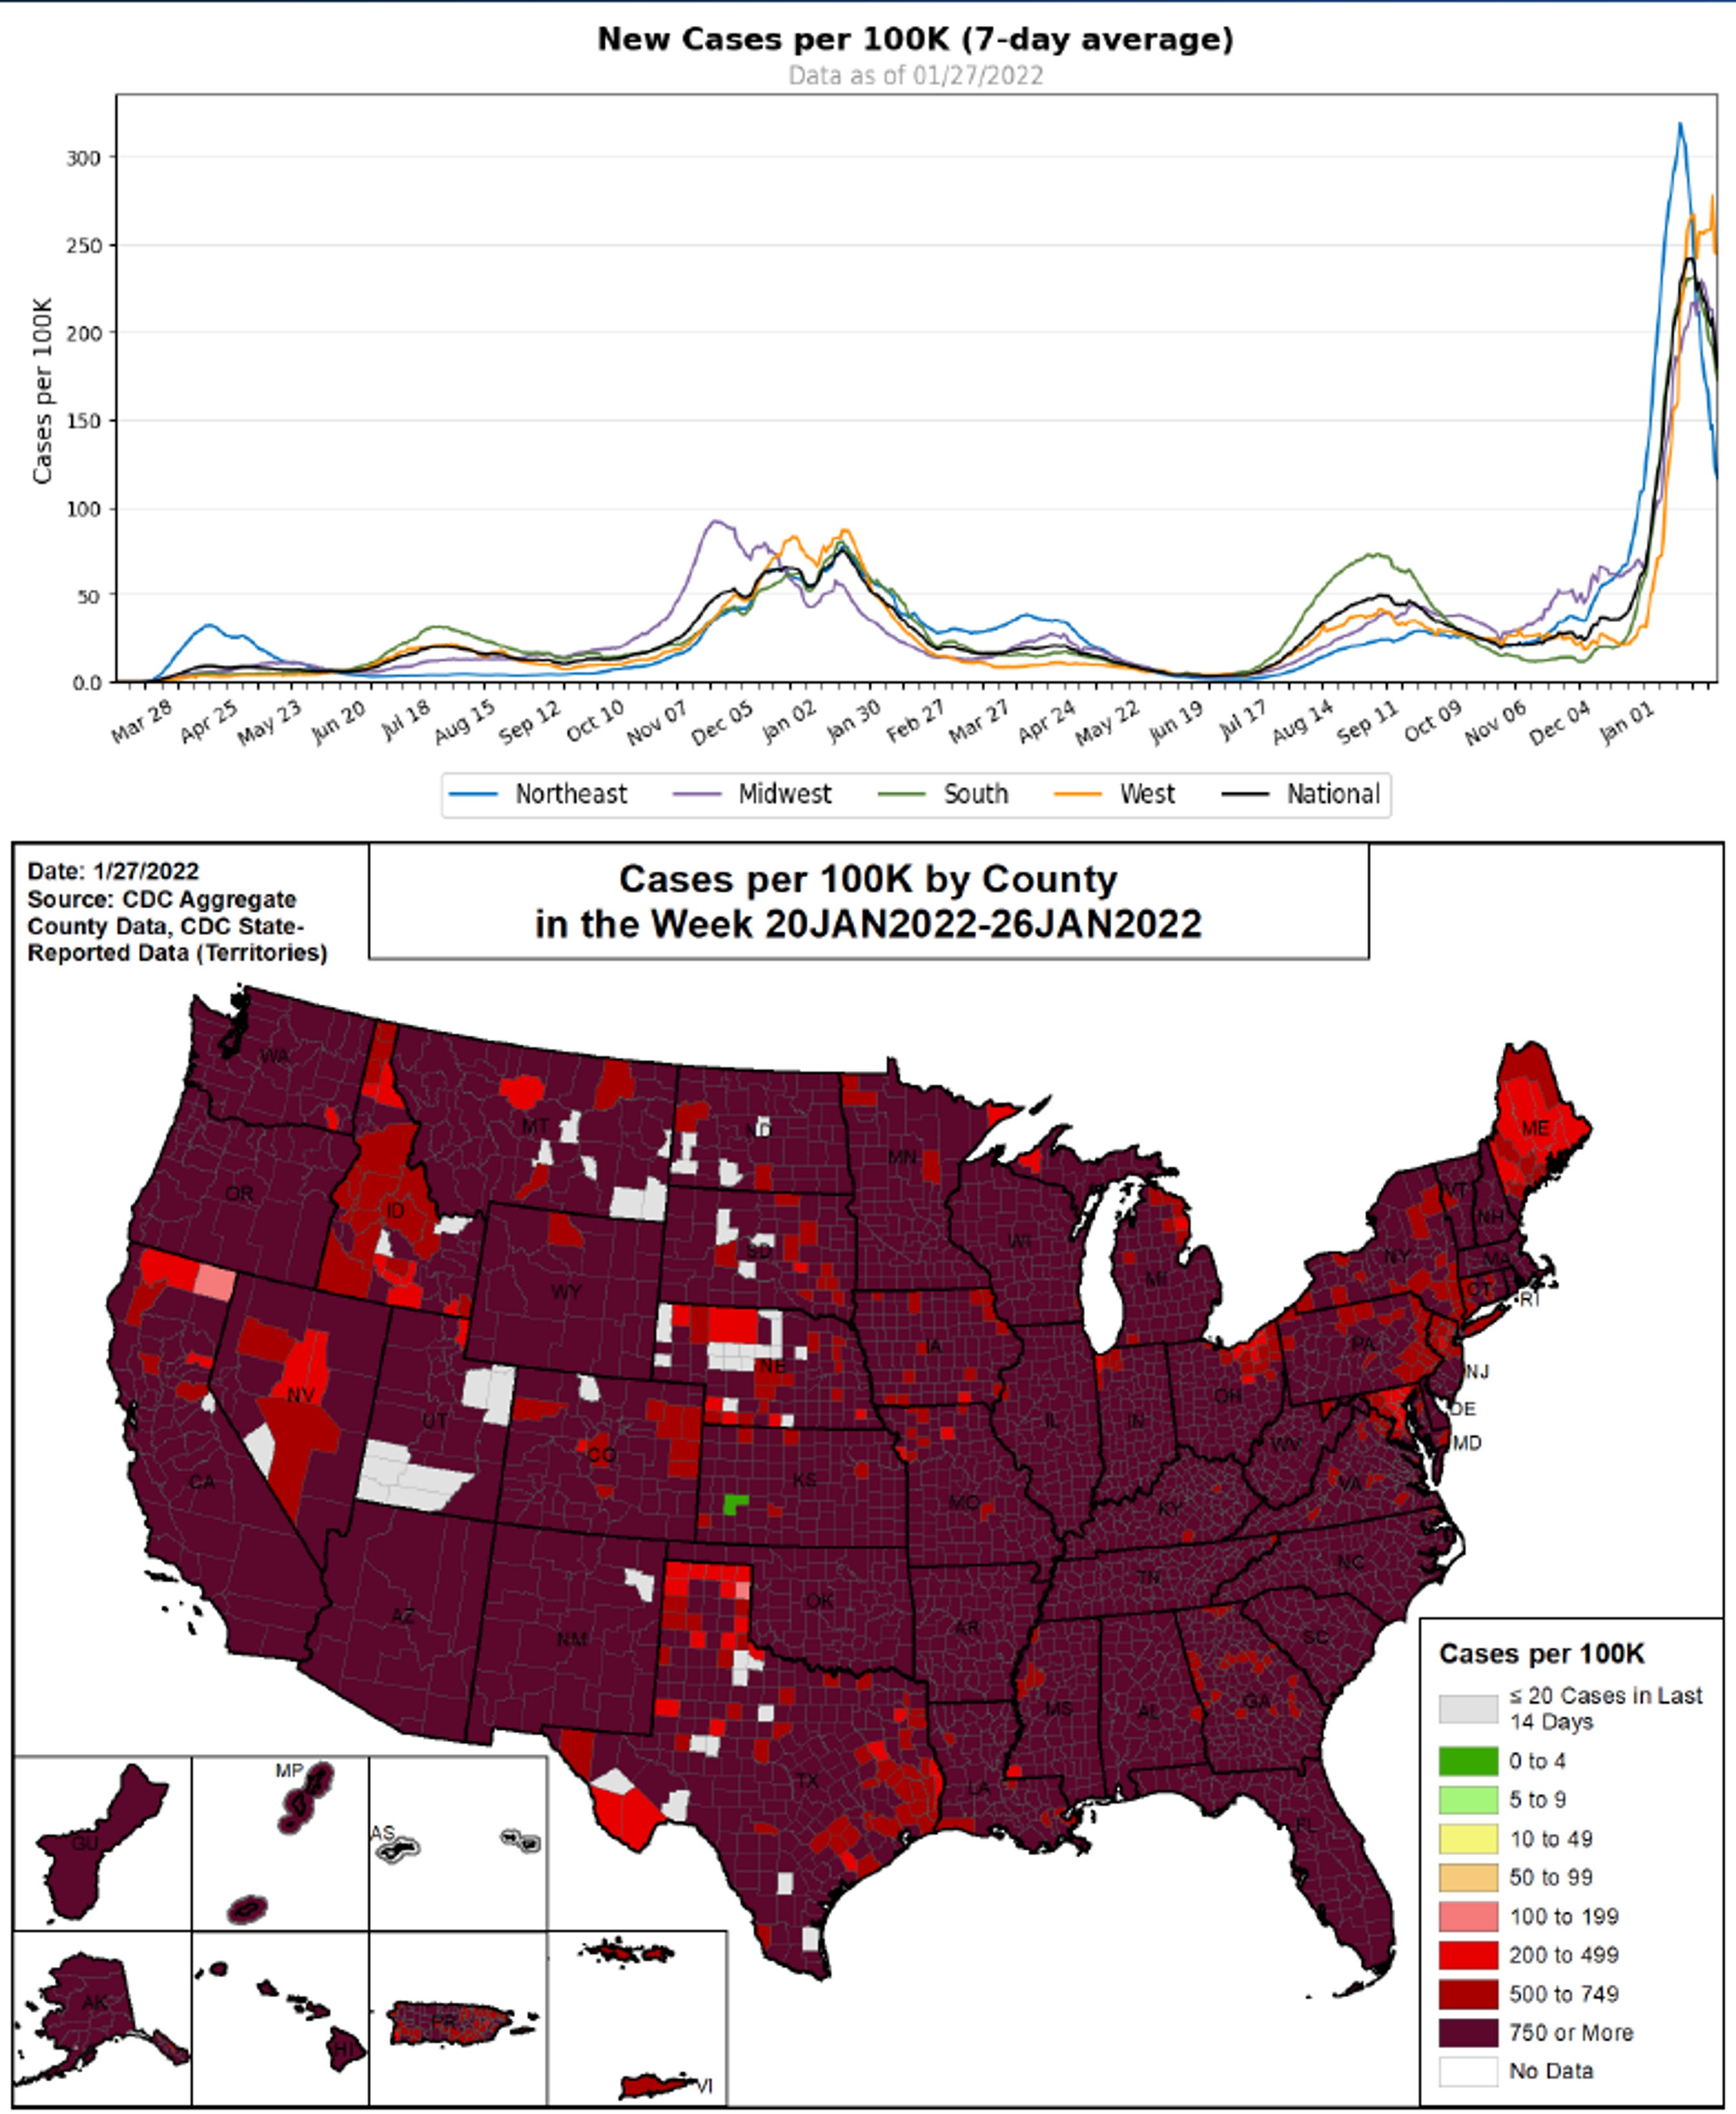
The map above shows case rate across the US. The point here is that things continue to be really rough, just about everywhere.
Keep reading with a 7-day free trial
Subscribe to The COVID Digest to keep reading this post and get 7 days of free access to the full post archives.