This week’s newsletter will probably be shorter than usual. I’m celebrating a family birthday during this lull between surges and want to prioritize family time.
All eyes are on Europe and parts of Asia as we start to see cases surge, attributed to a new variant of Omicron, called BA.2. If we look at the Omicron wave shown below, we can see that the US in maroon had a large peak that followed an even bigger peak in the United Kingdom (magenta). Next was a momentary peak in Germany (red). Cases fell in all three countries with similar peaks, but began to climb again about 6 weeks later in the UK. For Germany, the slide downward ended and reversed only 2 weeks later. I bring this up because we had a similarly large peak as Germany and United Kingdom. And those countries have a higher vaccination rate than the United States. We should expect that what’s happening in Germany and the UK will happen in the US too. A big disadvantage for Germany in this case was that they reversed the trend when they were still at a high state of disease transmission. The graph below comes from Our World in Data.
The BA.2 variant continues to grow in the US. The graph below comes from CDC and shows the proportion of variants found among sequenced specimens. The orange part of the bars is Delta. The various shades of pink and purple are Omicron. The one people are increasingly concerned about is the one in pink (BA.2). It is growing quickly.
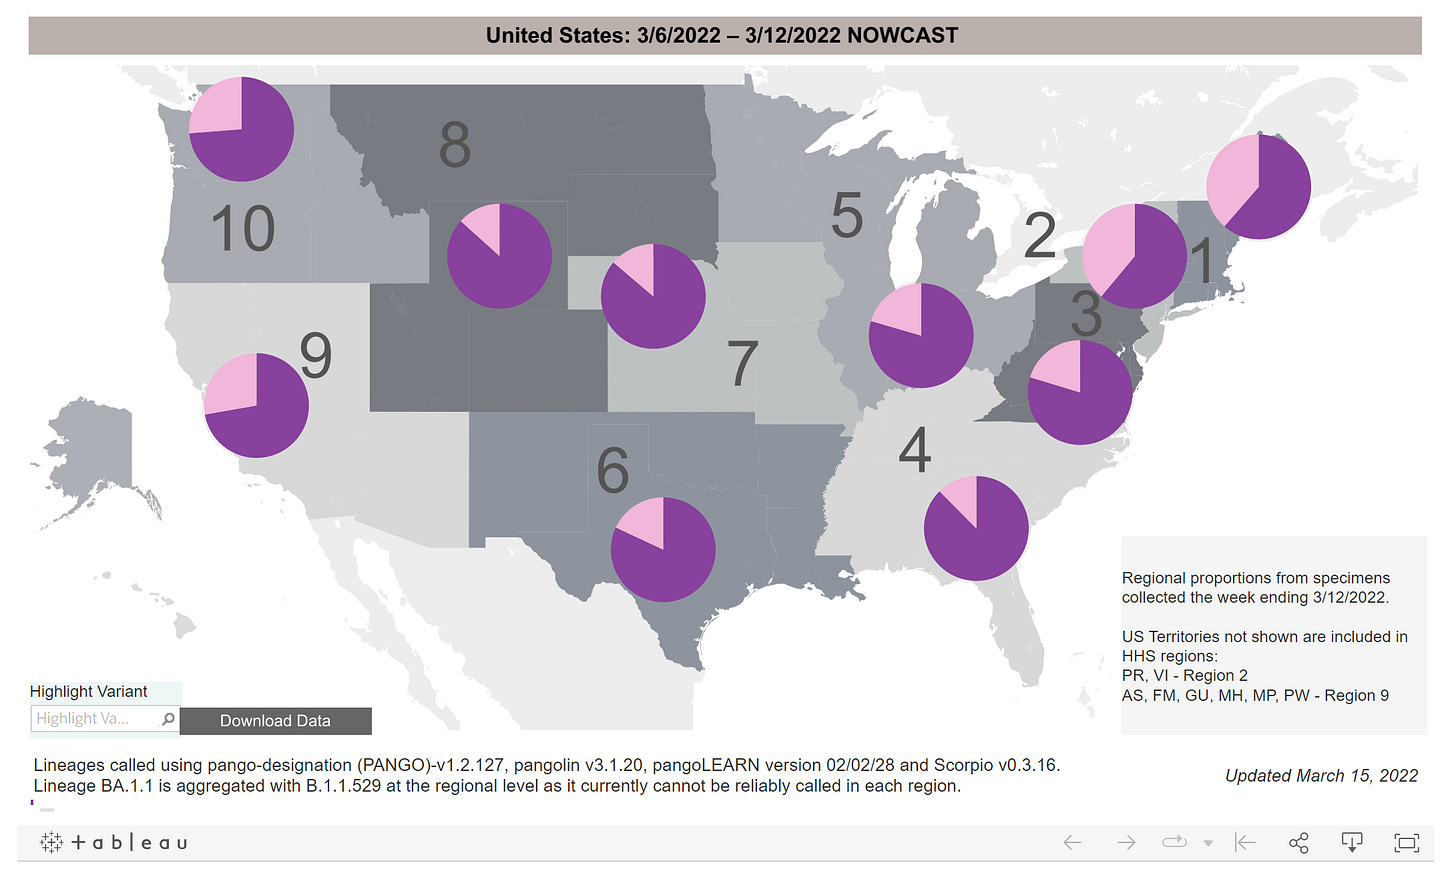
The map below shows the proportion of sequenced specimens by region. Again, the pink shows BA.2. If BA.2 is going to make a play, we might expect to see its effects first in the northeast, where the variant is at least one third of sequenced specimens.
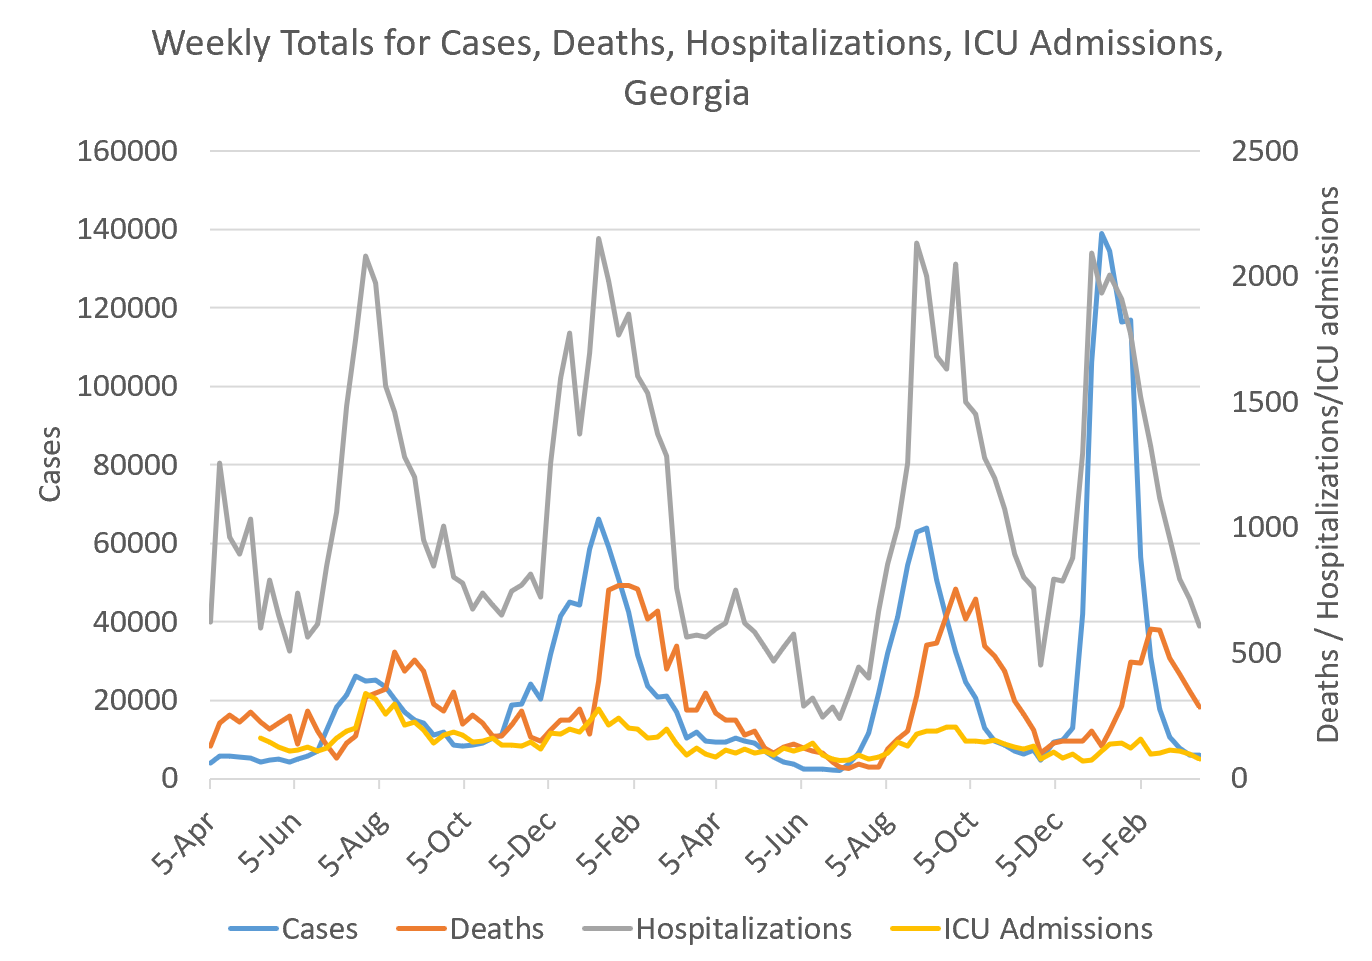
For the southeast, BA.2 is only about 12% of specimens. Turning to Georgia, here’s a look at the weekly trends for cases, hospitalizations, ICU admissions and deaths. Pay attention to what happened with cases this week (in blue).
And while cases are nearly the same as last week, they are rising for many age groups, including children 1-17 and 30-59.
Nor is the burden of disease distributed evenly across the state of Georgia. Things have been increasing in the southeast corner of the state.
That’s it for now. We’re in a place of waiting to see BA.2’s effect and hoping that it won’t be as bad as we are seeing in other countries, and it won’t be as bad as the previous Omicron wave. It’s a good time to stock up on COVID-19 tests and high quality masks.
References
Unless otherwise noted, the source data for all of these graphs is from the Georgia Department of Public Health daily status report and the Georgia Geospatial Information Office COVID-19 Data Hub. Many thanks to the public health data heroes at these organizations for providing these data to the public on a near-daily basis. Not all states offer this level of transparency.
Thank you for your support of the COVID Digest.
My Ph.D. is in Medical Microbiology and Immunology and I am Chair of the Division of Natural Sciences and Mathematics at the University of Saint Mary. I've worked at places like Creighton University, the Centers for Disease Control & Prevention and Mercer University School of Medicine. All thoughts are my professional opinion, do not represent the views or opinions of my employer and should not be considered medical advice.


Amber, we can’t thank you enough for all that you’ve done and continue to do! Your analysis and advice is invaluable. I hope you all have a wonderful birthday celebration! We look forward to reading your next post. Thanks again!