Geography, vaccinations and COVID-19
Today’s newsletter has a lot of data (as usual) and we’re looking at it using different ways of dividing up the country’s regions - FEMA and US Census Bureau. What we’re seeing out of the Northeast gives us a clue as to what we can expect from the Omicron variant. Meanwhile, much of the United States already has its hands full with Delta.
We’ll begin by looking at a familiar graph from the HHS Community Profile Report. It shows the US divided into US Census Bureau regions (see that map here). What we see first is the new case rate graph, adjusted for population. The Northeast region has overtaken the Midwest although they are at a virtual tie when it comes to new case rate. The South is also rising. The Northeast is approaching the previous peak experienced during the 2020-2021 winter surge.
Next, look at COVID-19 hospital admissions adjusted for population. The same trend we observed last week is continuing this week: although the case rate is nearly the same for the Midwest and the Northeast, the Midwest has a much higher hospital admission rate (about 40% higher). What accounts for this difference? Vaccination rate of the population.
Let’s take a look at what I mean when I say that vaccination rate is the explanation here. The table below also comes from the HHS Community Profile Report. I’ve sorted the country by recent case rate per population, with the 15 highest case rate states shown below. They are all either in the Northeast (blue) or the Midwest (purple) by US Census Bureau geography. To the right, I’ve highlighted any state with a vaccination rate below 70% and any state with a booster percentage below 30%. Combined, the average vaccination rate for the states shown in the Northeast (blue) is 70.3%. Meanwhile, the average vaccination rate for the states shown in the Midwest (purple) is 59.1%. So when we see a 40% reduction in hospitalization rates on a population level in the graph above, we are witnessing the protective power of vaccines. We should anticipate some breakthrough cases with Delta and the Omicron variants. But what these data suggest is that the way to preserve hospital capacity and to avoid the scary situation and expensive bills that come with hospitalization is to get vaccinated.
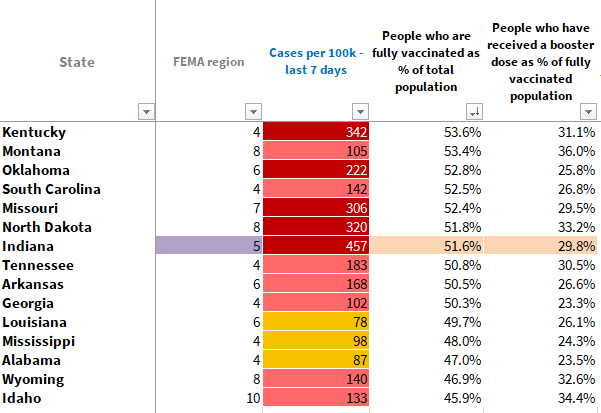
So if we are seeing this protective effect from vaccines, you might want to know who ISN’T likely to see that protective effect. There are only seven states above 70% right now (VT, RI, ME, CT, MA, WV, NY) so it’s most of the country. But who is the MOST vulnerable? Let’s re-sort the data to look at the lowest vaccination rates in the country. The bottom 15 states are shown below. We should anticipate that hospitals in these states will be hit hard if case rates rise dramatically. So if you’re a leader in one of these states my advice to you is to prepare NOW. Prepare as though a category 5 hurricane or similar natural disaster is heading to your state. Do whatever you can to build hospital capacity, ensure 911 service is fully staffed and supplied. Reissue mask mandates and limits on indoor gathering size. Push vaccination clinics anywhere that people gather. You have the benefit of time that other states do not have. Please don’t waste it.
Next let’s talk about Omicron and how this, combined with the data already presented, means rough weeks ahead for most of the country.
Keep reading with a 7-day free trial
Subscribe to The COVID Digest to keep reading this post and get 7 days of free access to the full post archives.


