

The COVID Digest, 17Jul2022
Post-holiday effect

Readers, I apologize for the delay on this newsletter. I celebrated my birthday this week and we moved into what may be our “forever” house this week. I was certainly still collecting data, but writing didn’t get the time and attention it usually does.
For Georgia and other states across the country, we saw big increases in cases that are partially due to the post-holiday catch up. If you recall, I mentioned last week that the small decreases we saw in cases were likely not entirely accurate since the week’s total included 1+ days of testing centers being closed for the 4th of July holiday. I warned that we should expect to see bigger than usual numbers for cases the following week. that has happened. This week, Georgia reported a weekly case total (26,603 between PCR and antigen-identified cases) that was 33% higher than the previous week’s total.
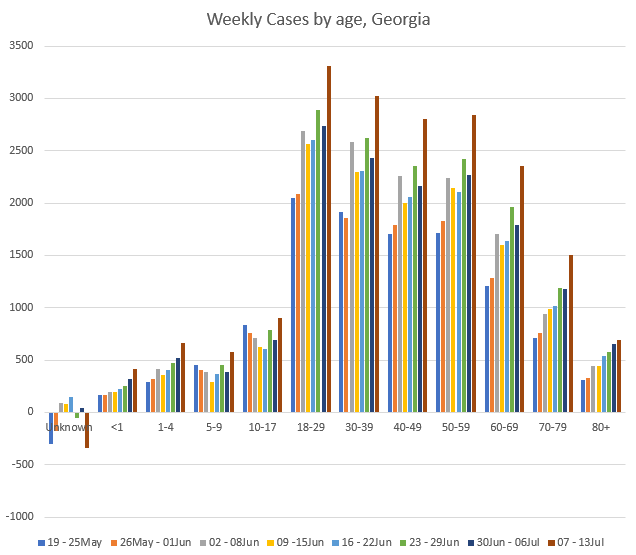
The graph below shows the case totals for the past 8 weeks for each age group, with the maroon colored bar representing the most recent week. You can see that cases rose for every age group. Again, this is a mix of real and not real. On the one hand, we know that the previous week was missing 1+ days’ worth of data and this week’s total is gaining 1+ days of extra data. It’s just a little bit of wonky data. I normally wouldn’t stress over a jump like this knowing that there’s been a holiday-related delay. But the increase is part of a trend that has been going on for a while - cases are going up dramatically in an 8 week span across most age groups (K-12 aged children being the exception).
Hospitalizations and ICU admissions for COVID-19 shouldn’t experience the same delays in reporting due to the holiday. So looking at those numbers can help us to see around the uncertainty of reporting delays. The downside to relying on this metric entirely is that it is a lagging indicator - when a surge in hospitalizations begins, we’re already behind on our awareness of the size of the problem. That’s because often people do not get sick enough to need a hospital until several days into their disease course. Prior to that, they may have been transmitting illness to others (often inadvertently). The point is, hospitalizations are not the best early warning sign. Still, we can see that COVID-19 hospital admissions and ICU admissions are climbing (dramatically for ICU admissions) in Georgia over the past several weeks. In fact, hospital admissions rose 8% this week and ICU admissions rose 48% this week compared to the previous week’s totals.

The next graph shows us, again, the past 8 weeks for each age group, this time for weekly hospitalization totals. More than twice as many 80+ Georgians are in the hospital this week compared to 8 weeks ago and the same is true for 30-39 and 50-59 year olds.

This seems like a good time to introduce a new graphic that the Centers for Disease Control and Prevention has produced - or at least, it’s the first time I’ve talked about it on the COVID Digest. If you click on the image, it will take you to the CDC website where it is normally found. For each age group shown on the left a color is assigned. To the right, there are three or more bars for each of those color categories: (1) pastel solid bar is the proportion of that age group that is fully vaccinated; (2) dark, dashed bar is the proportion eligible for the 1st booster; (3) dark, solid bar is the proportion who have received that booster dose.

Now, folks 50+ are eligible for a second booster (bar #4, darker dashed line) and the darkest solid bar (bar #5) indicates the proportion of that age group who has received the second booster, or is otherwise considered “fully up to date.”
There’s some pretty bleak information coming out of this graphic. Despite initial successes in getting a large proportion of those 50+ fully vaccinated (82% for 50-64 and 91.7% (!!!) for those 65+), there has not been as much success for the booster doses. In fact, only 9.1% of 50-64 year olds are fully up to date on their COVID-19 series. The only group performing worse for being fully up to date are children 5-11 years old, who don’t get to make those decisions or schedule their own appointments. More on the kiddos in a second. For those 65+, less than 1 in 4 people are fully up to date on their COVID-19 vaccines. Knowing this about vaccination rates, it should not be surprising that we are seeing so many more people 60+ going to the hospital. However, I want to give credit where credit is due. According to the data provided by CDC, Georgia is outperforming the national average in getting those 65+ fully up to date with two booster shots (25.5% compared to 22.7% nationally).
I want to be clear on a couple things here. The guidance on who can get a booster and when has been muddy at times. The latest guidance can be found here. If you’re eligible and want to schedule an appointment, you can find vaccines in your area at vaccines.gov, through your local health department, or potentially your physician’s office. Second, whereas there were lots of efforts to mobilize the vaccination effort during the primary series, we don’t see those same sorts of efforts now for the boosters. And that’s relevant when you remember that some of the folks most vulnerable to the worst that COVID-19 can do and might have the least ability to mitigate it are senior citizens who may be homebound, in a nursing home, might be intimidated by scheduling an appointment online, or who might otherwise have difficulty making those appointments. These numbers aren’t simply a choice not to vaccinate, the numbers also reflect barriers to access and lack of awareness in some cases. In short, it highlights how unsuccessful and unsupported the booster roll out has been by all levels of government.
Unfortunately, deaths rose this week by 43% compared to the previous week’s total in Georgia. There could be some impact of delayed reporting over the holiday, but death reporting can lag by as much as 8 weeks. So a single holiday is not likely to skew the numbers too much.
Like I showed graphs earlier for cases and hospital admissions, here is the 8 week graph for each age group for deaths. We can see that death certainly increases with age. This trend hasn’t really changed over time. But it is still difficult to see this continue to happen when we have vaccines that are very good at preventing hospitalization and death.

Of course, it is important to remember that survival and death are not the only outcomes of a COVID-19 infection. This virus causes semi-permanent and permanent disability in about 1 in 5 people.
I think that’s it for this week. I’ll hopefully be back on Wednesday with a more timely update. The weekly totals we get on Wednesday will be the first “normal” reporting week since the 4th of July holiday. So we should have a better sense of how intense the COVID-19 situation is at that time. In the meantime, I would assume that COVID-19 is everywhere. If you’ve been counting on luck (and maybe your vaccines) as your only mitigation strategy, it is a good time to add back some additional strategies like wearing a mask, avoiding crowds, and improving air quality through ventilation, outdoor activity, etc. Be safe and be well!
Unless otherwise stated, all data presented are publicly available from the Georgia Department of Public Health and the Georgia Geospatial Information Office. Thank you for your support of the COVID Digest.
My Ph.D. is in Medical Microbiology and Immunology and I am Chair of the Division of Natural Sciences and Mathematics at the University of Saint Mary. I've worked at places like Creighton University, the Centers for Disease Control & Prevention and Mercer University School of Medicine. All thoughts are my professional opinion, do not represent the views or opinions of my employer and should not be considered medical advice.
Thank you so much for the updates! I look forward to getting "the real story from you". As I have said before I believe the CDC, and the WH has dropped the ball on keeping us up to date on this life or death situation.
Thank you for doing this report! Happy Birthday! I hope you enjoy your new home, too!