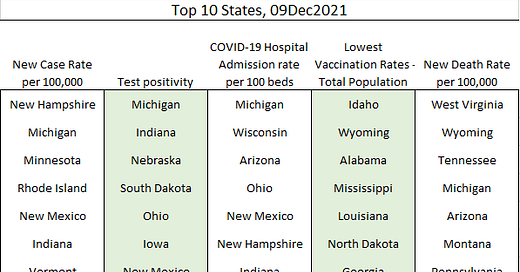
Using the most recent HHS Community Profile Report, these are the top 10 states for various COVID-19 disease metrics (top is where things are worst) and the bottom 10 states for total population vaccination rate. There is some overlap when it comes to low vaccination rates and the other metrics, but not in all cases. To me, what this might indicate is that although the disease is currently strongest in areas like Michigan, the states with the lowest vaccination rates are the most vulnerable when the disease begins to move around more.
Yesterday I was invited to talk about COVID-19 data trends with the University of Kansas Hospital System. They produce a Morning Medical Update Monday through Friday discussing various healthcare related topics. I’ve lately become their COVID “numbers gal” as the host puts it and numbers are climbing fast for the Kansas City Metro. You can watch the show here or read/watch the local press coverage of the show here.
We’re right around that time that we can start to see the early effects of the Thanksgiving gatherings. Because of the incubation period of the virus, the delays in seeking a test by those infected, the turn around time for tests and delays in reporting that information to the state, often the earliest time that we can see the impacts of a high exposure event is 10-14 days afterwards. The graph below shows US cases since the start of the pandemic. I’ve highlighted Thanksgiving 2021. You can see where reporting slowed because of laboratory closures over the holiday and the way that cases have risen since the holiday. The graph itself comes from the New York Times coronavirus tracker.
Keep reading with a 7-day free trial
Subscribe to The COVID Digest to keep reading this post and get 7 days of free access to the full post archives.


