

The COVID Digest, 10Jul2021
Week in Review for Georgia

The graph below shows how four of our big metrics for tracking the COVID-19 pandemic are tracking over time. Cases are represented by the blue line and correspond with the left y-axis. All other metrics correspond with the right y-axis. The reason I graph all of these things together is so that we can see the way these things trend together (or differently) over time.

This week cases rose by 73%, hospitalizations rose by 39% and ICU admissions rose by 4%. Deaths decreased by 13%. What we’ve seen in past surges is that cases and hospitalizations rise together. There’s a delay when deaths begin to rise, 3-5 weeks in the past and this is due to the length of time between infection and death in those who unfortunately succumb to the virus. We’ve seen increases before that don’t lead to a surge, but there is usually disagreement between cases and hospitalizations when that happens - they don’t necessarily rise together. If we see similar tandem increases with next week’s update, then it might be time to call this a surge.
In areas with high vaccine coverage, this surge may look different than the ones we’ve seen before. We may see cases and hospitalizations (albeit not as high as in previous surges) but not such a large spike in deaths. In areas with low vaccine coverage (like Georgia and much of the South), it’s more likely that this surge could look a lot like the ones we’ve seen before. The state has made it a priority to vaccinate as many people over 65 as they could. As of the 08Jul2021 HHS Community Profile Report, Georgia has fully vaccinated 71.3% of its population over the age of 65. For this, Georgia is 46th among US states. The low end of the herd immunity estimate is 70%, so this may sound really good. But “herd immunity” is something we use to describe closed social systems, like a herd of cattle. They don’t mingle with other cows from other farms. So 70% may be sufficient in that kind of population. But humans are an open social system that intermingles extensively. For that reason, we probably need to get somewhere like 85-90% vaccination rate in order to protect those who can’t be vaccinated. There are 13 states above 85% fully vaccinated for adults over 65. They might expect to see fewer deaths than states below 85%. In Georgia, 37.1% of the total population is fully vaccinated. For those 12-17 years old, it is 14.7%. For those 18+, the number is 47%. As a point of reference, let’s consider Missouri, where a surge of the delta variant is raging in the southwest corner of the state. Their fully vaccinated rates are: total population 39.5%, 12-17 17.7%, 18+ 49.1%, 65+ 73.3%. If the delta variant surges in Georgia, we should expect the state’s population to be hit hard by it.
For cases, here’s how Georgia county types are doing over the past month. The graph looks at 7-day case rate per 100,000 residents over time.
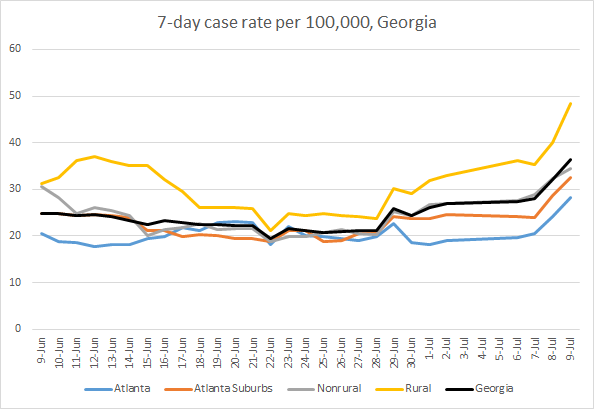
We can see that case rate is rising in all county types, rising highest for rural counties that often have low vaccination rates. Organizations like the Southern Economic Advancement Project and Fair Count have teamed up for an effort called CountMeIn, with the goal of improving vaccination rates in rural parts of the state. They invited me to do a COVID-19 vaccine “house call” to talk through how the vaccines work, why we each need one, the variants, etc. Note, we recorded this before I left for my vacation, so hopefully it’s all still relevant and not outdated. But you can view the video below.
If we look at confirmed cases reported over the past 8 weeks, here’s where the cases are coming from in terms of age. Note that this does not include antigen positive cases.

Every age group saw an increase this week, which is not surprising. I mean, we had a 73% increase in cases this week. Note that we are seeing increases, even in those 60+. In those over 60, they have a 21% hospitalization rate and a 9% death rate (both statistics are cumulative). Compare that to 5% and 2% for the general population in Georgia. So seeing cases rise in this age group, combined with the knowledge that we have only vaccinated ~70% of them means we should expect to see some impact on hospitalizations and deaths in the weeks to come.
But older populations are not the only people who need to worry about hospitalization from COVID-19. Nationally, if we look at hospitalization rates over the past week, the age groups with the greatest increase are those 30-49. Youth does not equal invincibility anymore.

So let’s look at what’s happening with hospitalizations in Georgia. Both COVID-19 patient census and new confirmed COVID-19 admissions are rising.

The HHS Community Profile Report (08Jul2021) notes a 31% rise in confirmed admission rate, so similar to what we’re hearing from the state. The state already has 9 counties with COVID-19 admissions rate that rank them in the red zone: (rank order) Evans, Early, Troup, Union, Douglas, Pulaski, Decatur, Clayton, Paulding. Let’s next look at where these hospitalizations are coming from in terms of age. The maroon bar is the most recent week. We can see increases for every group over the age of 10 except for 60-69 which saw a small decrease. Hospital admissions rose across all races this week.

Across the state, deaths decreased by 13% this week, but it did increase for some age groups - all those over the age of 70. So clearly, vaccinating 71.3% of those 65+ is not sufficient. Please do what you can to limit disease transmission to minimize these preventable deaths.

So we know that things are getting worse in terms of cases. We know that cases will likely fuel hospitalizations and deaths in the days and weeks to come. So how do we limit cases, and thereby limit hospitalizations and deaths? There are both personal and community responsibilities here. We need individuals to take steps like get vaccinated, wear masks indoors in public, stay home if experiencing any symptoms and get tested. But there are some things we need government to do here. First, we need to bulk up testing and contact trace capacity in areas that already have high test positivity rate. Unfortunately, that roster of counties is growing. We can’t control disease if we don’t know where it is or how big the problem is. The map below shows the Georgia counties with a test positivity above 5% as of 08Jul2021. The darker the color, the higher it is. I encourage you to click on the map to explore the pop ups over the counties. Because the color coding here is what’s used by HHS and it limits our ability to see how intense things are above 15%. But there are two counties (Wheeler and Webster) where test positivity is over 40%.

Look what happens in the graph below when we increase testing. It can knock test positivity down and that’s a good thing. It keeps us in a position where we are adequately testing to detect most, if not all, cases in a community.

The second thing local governments can do is bring the full court press when it comes to vaccinations. Prepare for delta as you would prepare for a hurricane. Instead of putting plywood on windows, this may look like going door to door offering vaccines. Increase public messaging efforts. Health departments can follow up with those with one dose of the two dose vaccine series and get that series completed. Hospitals may want to look at making sure they have adequate supplies and staff to withstand a surge. Southwest Missouri was caught off guard, having stopped many of the contracts for temporary nurses and respiratory therapists. Make sure local EMS is supplied and staffed as well. I spoke with a group of critical care nurses this week who told me they were still re-using N-95 masks, even while the COVID-19 situation was relatively calm.
Remember that while delta may be coming, we are not powerless against it. It is not inevitable that people will die and those people are not disposable. It takes basic consideration and concern for other people for us to save lives. We can do this.
References
https://covid-gagio.hub.arcgis.com/
https://dph.georgia.gov/covid-19-daily-status-report
https://beta.healthdata.gov/Health/COVID-19-Community-Profile-Report/gqxm-d9w9
The COVID Digest is a free newsletter that depends on reader support. If you wish to subscribe please click the link below. There are free and paid options available.
My Ph.D. is in Medical Microbiology and Immunology and I am Chair of the Division of Natural Sciences and Mathematics at the University of Saint Mary. I've worked at places like Creighton University, the Centers for Disease Control & Prevention and Mercer University School of Medicine. All thoughts are my professional opinion, do not represent the views or opinions of my employer and should not be considered medical advice.
Super analysis and advice. Thank you! Your efforts are so appreciated!