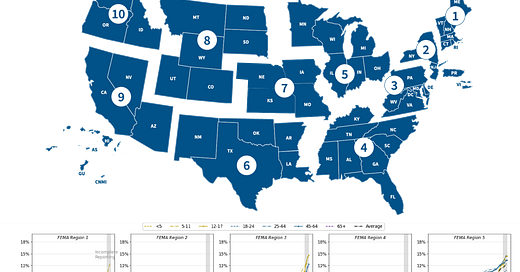
Things continue to heat up across the country when it comes to COVID-19. The US already has its hands full with the Delta variant. And this week several states were discovered to have the Omicron variant also.
There’s a lot we still don’t know about the Omicron variant and I’m not here to speculate. The US instituted a travel ban from South African countries. This move can only be good for one reason - to buy our country time to prepare for the spread of the Omicron variant. But we aren’t using that time to prepare. The President of the United States is continuing to encourage vaccines but has declined to put into place any other efforts to limit disease transmission. It is more of the same and wholly unequal to the challenge we face. In other words, we are on our own again. Let’s be clear, South Africa was just the first country to identify the variant, due in part to a really robust genomic surveillance program. We can’t find what we aren’t looking for. And only recently have we started to look for Omicron. The reason the 1918 Influenza Pandemic is called the Spanish Flu is because Spain was the first country to talk about it in the press. It originated at Fort Riley, Kansas. We are seeing the same thing play out with South Africa now and it is scientifically incorrect and politically misguided.
So where are we? The map below shows where case rates are most intense. I live near the northeast corner of Kansas, right in the thick of it. I can tell you that most people here are living their best lives, clearly ready to live a post-pandemic life. But that life is divorced from reality. My region is a sitting duck for Omicron and it is already in Colorado, Nebraska and Missouri. It is likely already in Kansas too.
For now, the South is in decent shape as it continues to experience the decline that seems to follow really big surges. But as we’ve seen before, those declines are temporary. And what I’ll show you next shows you that the decline after Delta is short-lived. This is a graph of cases for the Kansas City area. The peak that shot up in July is the same Delta wave that hit the South. There was a decline, but it ended in November and has been rising at an alarming rate ever since. We should not expect the long lull in cases that we saw last spring. The map above and the graph below come from the New York Times COVID Tracker.
So let’s talk about what this means.
Keep reading with a 7-day free trial
Subscribe to The COVID Digest to keep reading this post and get 7 days of free access to the full post archives.


