

The COVID Digest, 02Jun2021
Georgia COVID-19 Updates

Vaccine Update
The data provided in the table below are publicly available from the CDC update as of the morning of 02Jun2021. The table compares Georgia’s data to the US average. CDC indicates that Georgia has an inventory of 3,139,436 doses on hand, a decrease of about 54,000 doses compared to the previous week. It’s unclear if that’s because Georgia made major inroads in administering vaccines or because fewer doses are being shipped to the state. However, the data in the table below might suggest the former situation is correct. This week, Georgia improved in the rankings for 1st doses among the 12+ and 65+ population and also for fully vaccinated individuals for both total population and those 12+.
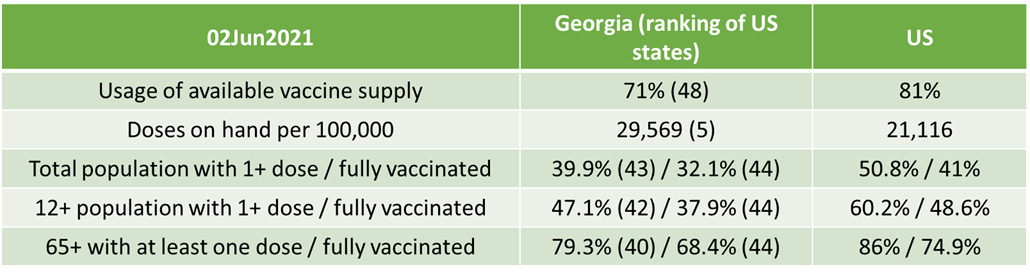
The Georgia Tech population level immunity estimate tool shows that when considering fully vaccinated individuals (and an infection ascertainment bias = 4), the US has an estimate population level immunity of 62%. That’s striking distance of the lower edge of the herd immunity range, 70%. For Georgia, the estimate is 58%. For neighboring Alabama, the estimate is 59%.

The United States
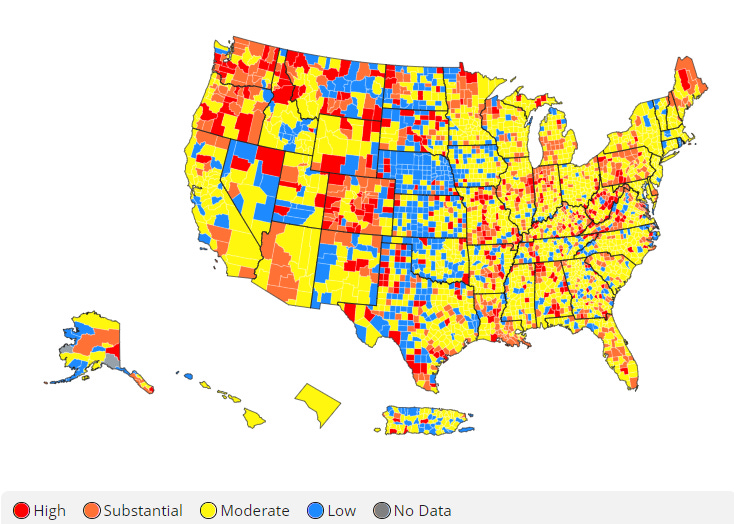
The map above comes from the CDC COVID-19 Tracker on the Community tab, county view. The map above looks at the combined community transmission indicators that looks at both case rate and test positivity. Red and orange are considered the danger zone, yellow is safer and blue is safest. The recent flare ups that we’ve seen in the Pacific Northwest, Rocky Mountain states and Northeast have subsided.
The table below tells you where we are this week and how that compares to the previous week (in parentheses). The data for everything comes from the HHS Community Profile Report from 01Jun2021.

Georgia has just one county in the top 20 counties in the US for new case rate per 100,000 residents. It’s Chattahoochee county, ranked at #3. Chattahoochee is likely an overrepresentation of cases (and vaccinations when we review those data) among military personnel temporarily residing on Fort Benning for training compared to the census of the population (where the temporary trainees are not counted). However, the US has a lot of military bases. And the counties that host them are not often in the top 20 counties. So I don’t have a good explanation for why Chattahoochee county and Fort Benning stand out the way that they do.
The table below shows the highest and lowest ranking states and territories from the latest HHS Community Profile Report (you can find the most recent edition here).

Georgia appears twice in this table, with the 5th worst hospital admission rate in the country and the 3rd worst death rate. Nationally, there are NO STATES or territories in the red zone for new case rate. In fact, there are no states or territories in the red zone for any of the top metrics. If we look at vaccinations, we can see that 21 states + 3 US territories are above 50% for the proportion of their total population that has received at least one dose of the COVID-19 vaccine. Georgia is not one of them. If we look at residents 65+ with at least one dose of the vaccine, 39 states plus DC are above 80%, which is really good! Georgia is not one of them, however they are very close, at 79.3%. Perhaps the state will join that group next week.
Georgia
We can zoom in on a current view of Georgia using the CDC community transmission criteria. This week, there are 11 red counties and 27 counties in the orange category. So there are 24% of the state’s counties in the substantial or high transmission categories (last week it was 27%). Nationally, 20% of US counties are in the red or orange zone. So Georgia is above the national average, but not drastically so.
This week, the entire Atlanta metro has shifted to yellow. In addition, central Georgia has transitioned from yellow and orange to yellow and blue - a good development also.

Testing
If we drill down to Georgia in the HHS data, we can see the following test positivity rate by age group in the chart below. All age groups are now testing positive at below 5%. That means we are more likely to be accurately counting disease rather than missing cases. The tricky part is staying below 5% over a sustained period of time.

It was a typical (and low) testing output day for Georgia. Test positivity was 3.2% for PCR tests and 2.1% for antigen tests.
Cases
Today there was a net increase of 491 newly reported cases for Georgia, with 367 identified by PCR and 124 by antigen testing. The state’s case rate is decreasing, and sits at a level we haven’t seen since 30Mar of last year.
Hospitalizations
Today there were 80 newly reported COVID-19 hospital admissions and 26 admissions to the ICU. The COVID-19 data hub for patient census is not working for the past two days.
Deaths
Today Georgia reported a net increase of 16 newly reported confirmed COVID-19 deaths and 13 probable deaths. The state’s 7-day death rate per 100,000 is lower now than at any other time in the pandemic to date.

I think this is definitely good news. But I would not say that we are home free here based on some of the data we’re beginning to see out of the United Kingdom, where regions that have lower vaccination rates are starting to see dramatic case surges due to the arrival of the newly designated Delta variant. You can see how this variant has spread across the world using the GISAID database animated map.
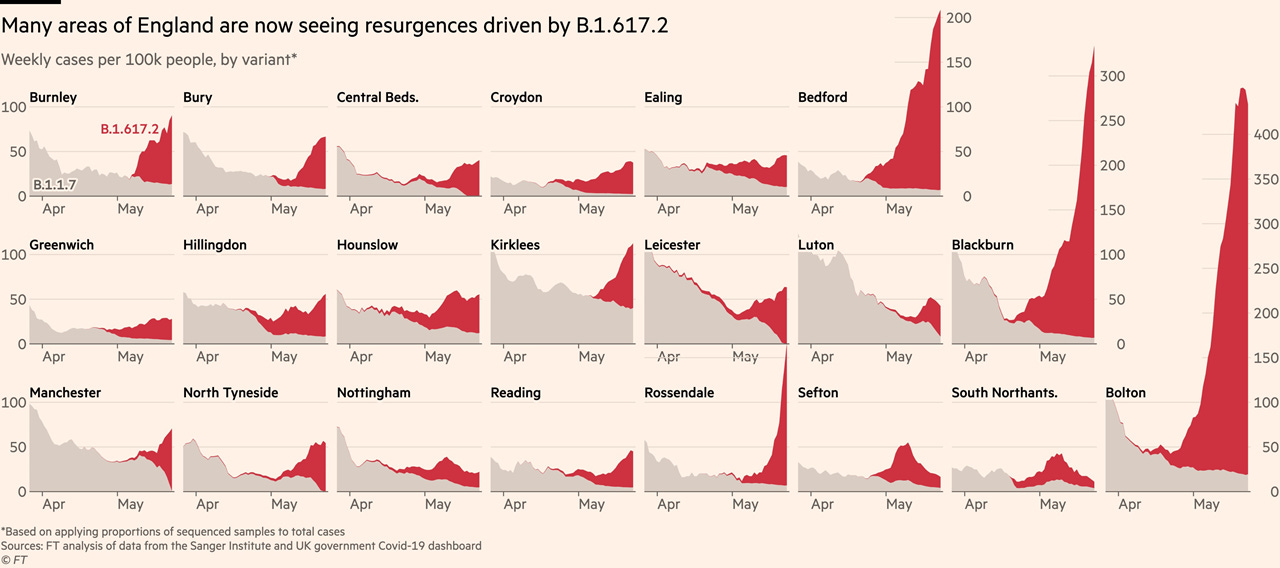
Between how low vaccination rates are across much of the South, the arrival of summer when people are less likely to want to spend time together outside, and the mistaken public perception that the pandemic is over, there is still potential for things to turn ugly and quickly. As you can see from the graphs above from the UK, things look okay and even calm until they are really not okay.

References
https://covid.cdc.gov/covid-data-tracker/#vaccinations
https://dph.georgia.gov/covid-19-daily-status-report
https://covid-gagio.hub.arcgis.com/
https://covid19dashboardgt.shinyapps.io/us_immunitylevel/
https://www.who.int/news/item/31-05-2021-who-announces-simple-easy-to-say-labels-for-sars-cov-2-variants-of-interest-and-concern
https://www.gisaid.org/hcov19-variants/
Georgia COVID-19 Updates is a free newsletter that depends on reader support. If you wish to subscribe please click the link below. There are free and paid options available.
My Ph.D. is in Medical Microbiology and Immunology. I've worked at places like Creighton University, the Centers for Disease Control & Prevention and Mercer University School of Medicine. All thoughts are my professional opinion and should not be considered medical advice.